Virgin Media 2013 Annual Report Download - page 53
Download and view the complete annual report
Please find page 53 of the 2013 Virgin Media annual report below. You can navigate through the pages in the report by either clicking on the pages listed below, or by using the keyword search tool below to find specific information within the annual report.-
 1
1 -
2
-
3
-
4
-
5
-
6
-
7
-
8
-
9
-
10
-
11
-
12
-
13
-
14
-
15
-
16
-
17
-
18
-
19
-
20
-
21
-
22
-
23
-
24
-
25
-
26
-
27
-
28
-
29
-
30
-
31
-
32
-
33
-
34
-
35
-
36
-
37
-
38
-
39
-
40
-
41
-
42
-
 43
43 -
 44
44 -
 45
45 -
 46
46 -
 47
47 -
 48
48 -
 49
49 -
 50
50 -
 51
51 -
 52
52 -
 53
53 -
 54
54 -
 55
55 -
 56
56 -
 57
57 -
 58
58 -
 59
59 -
 60
60 -
 61
61 -
 62
62 -
 63
63 -
64
-
65
-
66
-
67
-
68
-
69
-
70
-
71
-
72
-
73
-
74
-
75
-
76
-
77
-
78
-
79
-
80
-
81
-
82
-
83
-
84
-
85
-
86
-
87
-
88
-
89
-
90
-
91
-
92
-
93
-
94
-
95
-
96
-
97
-
98
-
99
-
100
-
101
-
102
-
103
-
104
-
105
-
106
-
107
-
108
-
109
-
110
-
111
-
112
-
113
-
114
-
115
-
116
-
117
-
118
-
119
-
120
-
121
-
122
-
123
-
124
-
125
-
126
-
127
-
128
-
129
-
130
-
131
-
132
-
133
-
134
-
135
-
136
-
137
-
138
-
139
 |
 |

VIRGIN MEDIA INC.
(See note 1)
Notes to Consolidated Financial Statements — (Continued)
December 31, 2013, 2012 and 2011
II - 28
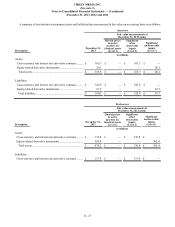
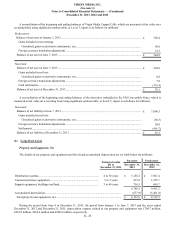
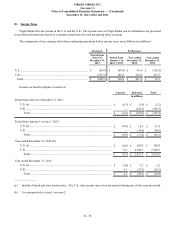
A reconciliation of the beginning and ending balances of Virgin Media Capped Calls, which are measured at fair value on a
recurring basis using significant unobservable, or Level 3, inputs is as follows (in millions):
Predecessor:
Balance of net asset at January 1, 2013 ................................................................................................................ £ 302.4
Gains included in net earnings:
Unrealized gains on derivative instruments, net............................................................................................ 50.0
Foreign currency translation adjustments.......................................................................................................... 12.5
Balance of net asset at June 7, 2013..................................................................................................................... £ 364.9
Successor:
Balance of net asset at June 7, 2013..................................................................................................................... £ 364.9
Gains included in net loss:
Unrealized gains on derivative instruments, net............................................................................................ 0.8
Foreign currency translation adjustments.......................................................................................................... 7.8
Cash settlements................................................................................................................................................. (353.4)
Balance of net asset at December 31, 2013.......................................................................................................... £ 20.1
A reconciliation of the beginning and ending balances of the derivative embedded in the VM Convertible Notes, which is
measured at fair value on a recurring basis using significant unobservable, or Level 3, inputs is as follows (in millions):
Successor:
Balance of net liability at June 7, 2013................................................................................................................ £ 1,068.5
Gains included in net loss:
Unrealized gains on derivative instruments, net............................................................................................ (30.3)
Foreign currency translation adjustments.......................................................................................................... 20.8
Settlements......................................................................................................................................................... (991.7)
Balance of net liability at December 31, 2013..................................................................................................... £ 67.3
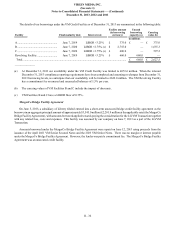
(6) Long-lived Assets
Property and Equipment, Net
The details of our property and equipment and the related accumulated depreciation are set forth below (in millions):
Estimated useful
life at
December 31, 2013
Successor Predecessor
December 31,
2013 December 31,
2012
Distribution systems.................................................................................... 4 to 30 years £ 5,158.2 £ 7,947.4
Customer premises equipment .................................................................... 3 to 5 years 915.8 1,355.1
Support equipment, buildings and land....................................................... 3 to 40 years 716.5 690.7
6,790.5 9,993.2
Accumulated depreciation........................................................................................................... (677.9)(5,481.0)
Total property and equipment, net............................................................................................ £ 6,112.6 £ 4,512.2
During the period from June 8 to December 31, 2013, the period from January 1 to June 7, 2013 and the years ended
December 31, 2012 and December 31, 2011, depreciation expense related to our property and equipment was £704.7 million,
£432.8 million, £966.4 million and £928.0 million, respectively.