Virgin Media 2013 Annual Report Download - page 117
Download and view the complete annual report
Please find page 117 of the 2013 Virgin Media annual report below. You can navigate through the pages in the report by either clicking on the pages listed below, or by using the keyword search tool below to find specific information within the annual report.-
 1
1 -
2
-
3
-
4
-
5
-
6
-
7
-
8
-
9
-
10
-
11
-
12
-
13
-
14
-
15
-
16
-
17
-
18
-
19
-
20
-
21
-
22
-
23
-
24
-
25
-
26
-
27
-
28
-
29
-
30
-
31
-
32
-
33
-
34
-
35
-
36
-
37
-
38
-
39
-
40
-
41
-
42
-
43
-
44
-
45
-
46
-
47
-
48
-
49
-
50
-
51
-
52
-
53
-
54
-
55
-
56
-
57
-
58
-
59
-
60
-
61
-
62
-
63
-
64
-
65
-
66
-
67
-
68
-
69
-
70
-
71
-
72
-
73
-
74
-
75
-
76
-
77
-
78
-
79
-
80
-
81
-
82
-
83
-
84
-
85
-
86
-
87
-
88
-
89
-
90
-
91
-
92
-
93
-
94
-
95
-
96
-
97
-
98
-
99
-
100
-
101
-
102
-
103
-
104
-
105
-
106
-
 107
107 -
 108
108 -
 109
109 -
 110
110 -
 111
111 -
 112
112 -
 113
113 -
 114
114 -
 115
115 -
 116
116 -
 117
117 -
 118
118 -
 119
119 -
 120
120 -
 121
121 -
 122
122 -
 123
123 -
 124
124 -
 125
125 -
 126
126 -
 127
127 -
128
-
129
-
130
-
131
-
132
-
133
-
134
-
135
-
136
-
137
-
138
-
139
 |
 |
III - 7
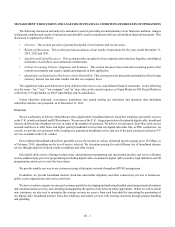
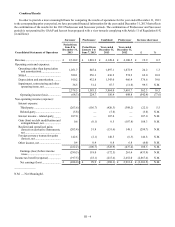
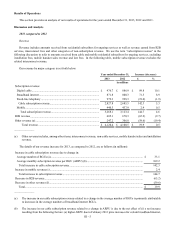
Operating expenses
Operating expenses include programming, network operations, interconnect, customer operations, customer care and other
costs related to our operations. Programming costs, which represent a significant portion of our operating costs, are expected to
rise in future periods as a result of (i) higher costs associated with the expansion of our digital cable content, including rights
associated with ancillary product offerings and rights that provide for the broadcast of live sporting events, and (ii) rate increases.
In addition, we are subject to inflationary pressures with respect to our labor and other costs. Any cost increases that we are not
able to pass on to our subscribers through service rate increases would result in increased pressure on our operating margins.
Our total operating expenses increased £24.2 million or 1.3% during 2013, as compared to 2012. This increase includes the
following factors:
• An increase in programming and related costs of £33.8 million or 6.7%, due primarily to the impact of (i) growth in
digital services and (ii) rate increases for live sports content and, to a lesser degree, other premium content;
• A decrease in interconnect and access costs of £22.1 million or 5.9%, due primarily to the net effect of (i) lower mobile
and fixed-line telephony termination rates, (ii) an increase due to the net negative impact of (a) higher costs due to the
net releases of accruals associated with favorable settlements of operational contingencies of £2.0 million during the
second quarter of 2013 and £6.0 million during the fourth quarter of 2012 and (b) the release of accruals associated with
the reassessment of operational contingencies of £1.0 million and £5.6 million in the first and third quarters of 2012,
respectively, and (iii) a decline in B2B and residential telephony call volumes. As further described in note 3 to our
consolidated financial statements, interconnect and access costs also include amortization of an unfavorable capacity
contract to adjust the contract to its estimated fair value, which will continue through March 31, 2014, the expiration date
of the contract;
• A decrease in other direct costs of £17.5 million, due primarily to the net effect of (i) lower B2B circuit rental costs
primarily associated with the migration of the traffic of one of our customers to our network and (ii) a decline in DSL
usage as a result of a decline in our non-cable operations;
• An increase in equipment costs of £12.7 million or 9.1%, due primarily to (i) an increase in mobile handset costs as a
result of our growing postpaid customer base and the introduction of higher value handsets and (ii) increased B2B local
area network equipment sales;
• An increase in facilities costs of £10.4 million or 33.3%, primarily due to the impact of property tax refunds of £9.6
million received during 2012;
• A decrease in network-related costs of £5.0 million or 2.4%, due primarily to the net effect of (i) adjustments made to
our capitalization policy in the fourth quarter of 2012 to begin capitalizing certain upgrade activities that had not previously
been capitalized, which had an impact of reducing costs during 2013 by £9.4 million, (ii) a £2.0 million decrease associated
with the adoption of Liberty Global’s accounting policies during the Successor period and (iii) individually insignificant
increases in other network-related costs including higher maintenance costs;
• An increase in personnel costs of £3.6 million or 1.5%, due primarily to the net effect of (i) an increase in staffing levels
and (ii) an increase in capitalized costs due to the impact of (a) an increase in the level of capitalizable activities and (b)
an increase due to adjustments associated with the adoption of Liberty Global’s accounting policies during the Successor
period; and
• A net increase resulting from individually insignificant changes in other operating expense categories.
SG&A expenses
SG&A expenses include human resources, information technology, general services, management, finance, legal and sales
and marketing costs, share-based compensation and other general expenses. We do not include share-based compensation in the
following discussion and analysis of our SG&A expenses as share-based compensation expense is discussed separately below. As
noted above, we are subject to inflationary pressures with respect to our labor and other costs.
Our total SG&A expenses (exclusive of share-based compensation) decreased £19.8 million or 3.6% during 2013, as compared
to 2012. This decrease includes the following factors: