Virgin Media 2013 Annual Report Download - page 130
Download and view the complete annual report
Please find page 130 of the 2013 Virgin Media annual report below. You can navigate through the pages in the report by either clicking on the pages listed below, or by using the keyword search tool below to find specific information within the annual report.-
 1
1 -
2
-
3
-
4
-
5
-
6
-
7
-
8
-
9
-
10
-
11
-
12
-
13
-
14
-
15
-
16
-
17
-
18
-
19
-
20
-
21
-
22
-
23
-
24
-
25
-
26
-
27
-
28
-
29
-
30
-
31
-
32
-
33
-
34
-
35
-
36
-
37
-
38
-
39
-
40
-
41
-
42
-
43
-
44
-
45
-
46
-
47
-
48
-
49
-
50
-
51
-
52
-
53
-
54
-
55
-
56
-
57
-
58
-
59
-
60
-
61
-
62
-
63
-
64
-
65
-
66
-
67
-
68
-
69
-
70
-
71
-
72
-
73
-
74
-
75
-
76
-
77
-
78
-
79
-
80
-
81
-
82
-
83
-
84
-
85
-
86
-
87
-
88
-
89
-
90
-
91
-
92
-
93
-
94
-
95
-
96
-
97
-
98
-
99
-
100
-
101
-
102
-
103
-
104
-
105
-
106
-
107
-
108
-
109
-
110
-
111
-
112
-
113
-
114
-
115
-
116
-
117
-
118
-
119
-
 120
120 -
 121
121 -
 122
122 -
 123
123 -
 124
124 -
 125
125 -
 126
126 -
 127
127 -
 128
128 -
 129
129 -
 130
130 -
 131
131 -
 132
132 -
 133
133 -
 134
134 -
 135
135 -
 136
136 -
 137
137 -
 138
138 -
 139
139
 |
 |

III - 20
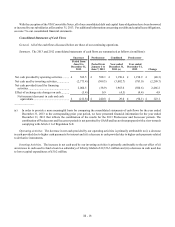
due to higher capital expenditures and (iii) an increase in cash used of £108.2 million associated with a loan repayment from an
equity investee during 2011.
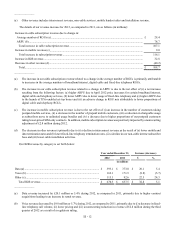
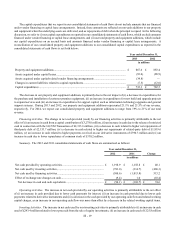
A reconciliation of our consolidated property and equipment additions to our consolidated capital expenditures as reported in
the consolidated statements of cash flows is set forth below:
Year ended December 31,
2012 2011
in millions
Property and equipment additions .................................................................................................... £ 883.4 £ 763.0
Assets acquired under capital leases................................................................................................. (88.9)(91.2)
Changes in current liabilities related to capital expenditures........................................................... (12.0)(15.1)
Capital expenditures ......................................................................................................................... £ 782.5 £ 656.7
The increase in our property and equipment additions is primarily due to the net effect of (i) an increase in expenditures for
new build and upgrade projects to expand services and (ii) a decrease in expenditures for the purchase and installation of customer
premises equipment. During 2012 and 2011, our property and equipment additions represented 21.5% and 19.1% of our revenue,
respectively.
Financing Activities. The decrease in net cash used by our financing activities is primarily attributable to the net effect of (i)
a decrease in cash used of £433.3 million related to higher net borrowings of debt, (ii) a decrease in cash used of £304.8 million
due to lower repurchases of common stock, (iii) an increase in cash used of £125.1 million due to higher payments of financing
costs and debt premiums and (vi) an increase in cash used of £94.3 million due to lower cash received related to derivative
instruments.
Off Balance Sheet Arrangements
In the ordinary course of business, we may provide indemnifications to our lenders, our vendors and certain other parties and
performance and/or financial guarantees to local municipalities, our customers and vendors. Historically, these arrangements have
not resulted in our company making any material payments and we do not believe that they will result in material payments in the
future.
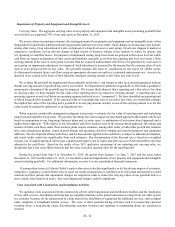
Contractual Commitments
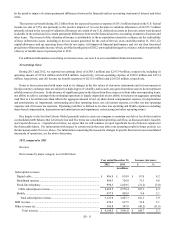
The pound sterling equivalents of our contractual commitments as of December 31, 2013 are presented below:
Payments due during:
2014 2015 2016 2017 2018 Thereafter Total
in millions
Debt (excluding interest)........................... £ 70.9 £ — £ — £ — £ 1,478.6 £ 6,542.9 £ 8,092.4
Capital leases (excluding interest)............. 87.0 62.0 34.3 7.5 0.1 34.6 225.5
Programming obligations .......................... 188.7 163.0 115.5 47.7 16.0 — 530.9
Network and connectivity commitments... 106.8 98.1 78.9 76.5 18.9 5.0 384.2
Purchase commitments.............................. 234.7 27.7 — — — — 262.4
Operating leases......................................... 37.6 32.2 25.5 18.9 13.1 51.7 179.0
Other commitments ................................... 89.5 66.8 36.6 26.4 9.8 — 229.1
Total (a)................................................. £ 815.2 £ 449.8 £ 290.8 £ 177.0 £ 1,536.5 £ 6,634.2 £ 9,903.5
Projected cash interest payments on debt
and capital lease obligations (b)............. £ 462.4 £ 458.7 £ 456.5 £ 453.3 £ 402.9 £ 879.7 £ 3,113.5