Virgin Media 2013 Annual Report Download - page 106
Download and view the complete annual report
Please find page 106 of the 2013 Virgin Media annual report below. You can navigate through the pages in the report by either clicking on the pages listed below, or by using the keyword search tool below to find specific information within the annual report.-
 1
1 -
2
-
3
-
4
-
5
-
6
-
7
-
8
-
9
-
10
-
11
-
12
-
13
-
14
-
15
-
16
-
17
-
18
-
19
-
20
-
21
-
22
-
23
-
24
-
25
-
26
-
27
-
28
-
29
-
30
-
31
-
32
-
33
-
34
-
35
-
36
-
37
-
38
-
39
-
40
-
41
-
42
-
43
-
44
-
45
-
46
-
47
-
48
-
49
-
50
-
51
-
52
-
53
-
54
-
55
-
56
-
57
-
58
-
59
-
60
-
61
-
62
-
63
-
64
-
65
-
66
-
67
-
68
-
69
-
70
-
71
-
72
-
73
-
74
-
75
-
76
-
77
-
78
-
79
-
80
-
81
-
82
-
83
-
84
-
85
-
86
-
87
-
88
-
89
-
90
-
91
-
92
-
93
-
94
-
95
-
 96
96 -
 97
97 -
 98
98 -
 99
99 -
 100
100 -
 101
101 -
 102
102 -
 103
103 -
 104
104 -
 105
105 -
 106
106 -
 107
107 -
 108
108 -
 109
109 -
 110
110 -
 111
111 -
 112
112 -
 113
113 -
 114
114 -
 115
115 -
 116
116 -
117
-
118
-
119
-
120
-
121
-
122
-
123
-
124
-
125
-
126
-
127
-
128
-
129
-
130
-
131
-
132
-
133
-
134
-
135
-
136
-
137
-
138
-
139
 |
 |

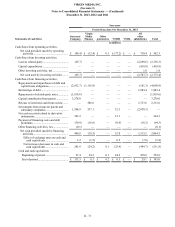
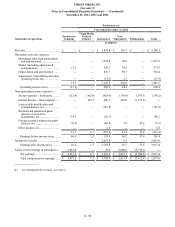
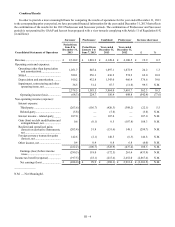
VIRGIN MEDIA INC.
(See note 1)
Notes to Consolidated Financial Statements — (Continued)
December 31, 2013, 2012 and 2011
II - 81
Predecessor
Year ended December 31, 2011
Statements of operations Predecessor
Company
Virgin Media
Secured
Finance Guarantors Non-
Guarantors Eliminations Total
in millions
Revenue................................................. £ — £ — £ 3,534.5 £ 457.3 £ — £ 3,991.8
Operating costs and expenses:
Operating (other than depreciation
and amortization) .......................... — — 1,538.2 328.4 — 1,866.6
SG&A (including share-based
compensation)............................... 13.2 — 490.8 31.3 — 535.3
Depreciation and amortization.......... — — 922.1 124.3 — 1,046.4
Impairment, restructuring and other
operating items, net....................... — — 4.9 1.9 — 6.8
13.2 — 2,956.0 485.9 — 3,455.1
Operating income (loss) ................. (13.2) — 578.5 (28.6) — 536.7
Non-operating income (expense):
Interest expense – third-party ........... (66.2) (152.3)(1,050.1)(443.5) 1,271.7 (440.4)
Interest income – intercompany........ 3.6 153.8 687.1 427.2 (1,271.7) —
Loss on debt modification and
extinguishment, net....................... — — (47.2) — — (47.2)
Realized and unrealized losses on
derivative instruments, net............ (43.4) — (7.3) — — (50.7)
Foreign currency transaction gains
(losses), net.................................... (0.4) — 22.7 (24.7) — (2.4)
Other income, net.............................. 0.1 — 78.0 19.0 — 97.1
(106.3) 1.5 (316.8)(22.0) — (443.6)
Earnings (loss) before income
taxes............................................ (119.5) 1.5 261.7 (50.6) — 93.1
Income tax benefit (expense)................. — — (18.9) 2.9 — (16.0)
Earnings (loss) after income
taxes............................................ (119.5) 1.5 242.8 (47.7) — 77.1
Loss of discontinued operation, net of
tax....................................................... — — — (1.2) — (1.2)
Equity in net earnings (loss) of
subsidiaries......................................... 195.4 — (34.9) 244.3 (404.8) —
Net earnings.................................... £ 75.9 £ 1.5 £ 207.9 £ 195.4 £ (404.8) £ 75.9
Total comprehensive earnings........ £ 19.4 £ 1.5 £ 164.2 £ 151.1 £ (316.8) £ 19.4