Virgin Media 2013 Annual Report Download - page 50
Download and view the complete annual report
Please find page 50 of the 2013 Virgin Media annual report below. You can navigate through the pages in the report by either clicking on the pages listed below, or by using the keyword search tool below to find specific information within the annual report.-
 1
1 -
2
-
3
-
4
-
5
-
6
-
7
-
8
-
9
-
10
-
11
-
12
-
13
-
14
-
15
-
16
-
17
-
18
-
19
-
20
-
21
-
22
-
23
-
24
-
25
-
26
-
27
-
28
-
29
-
30
-
31
-
32
-
33
-
34
-
35
-
36
-
37
-
38
-
39
-
 40
40 -
 41
41 -
 42
42 -
 43
43 -
 44
44 -
 45
45 -
 46
46 -
 47
47 -
 48
48 -
 49
49 -
 50
50 -
 51
51 -
 52
52 -
 53
53 -
 54
54 -
 55
55 -
 56
56 -
 57
57 -
 58
58 -
 59
59 -
 60
60 -
61
-
62
-
63
-
64
-
65
-
66
-
67
-
68
-
69
-
70
-
71
-
72
-
73
-
74
-
75
-
76
-
77
-
78
-
79
-
80
-
81
-
82
-
83
-
84
-
85
-
86
-
87
-
88
-
89
-
90
-
91
-
92
-
93
-
94
-
95
-
96
-
97
-
98
-
99
-
100
-
101
-
102
-
103
-
104
-
105
-
106
-
107
-
108
-
109
-
110
-
111
-
112
-
113
-
114
-
115
-
116
-
117
-
118
-
119
-
120
-
121
-
122
-
123
-
124
-
125
-
126
-
127
-
128
-
129
-
130
-
131
-
132
-
133
-
134
-
135
-
136
-
137
-
138
-
139
 |
 |

VIRGIN MEDIA INC.
(See note 1)
Notes to Consolidated Financial Statements — (Continued)
December 31, 2013, 2012 and 2011
II - 25
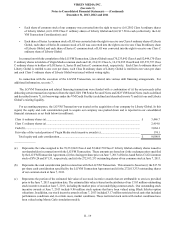
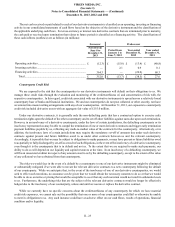
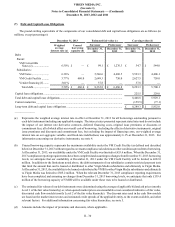
Interest Rate Swaps:
The terms of our outstanding interest rate swap contracts at December 31, 2013, which are held by VMIH, are as follows:
Final maturity date (a) Notional amount Interest rate due from
counterparty Interest rate due to
counterparty
in millions
October 2018 ................................................. £ 2,155.0 6 mo. LIBOR 1.52%
January 2021.................................................. £ 650.0 5.50% 6 mo. LIBOR + 1.84%
January 2021.................................................. £ 650.0 6 mo. LIBOR + 1.84% 3.87%
December 2015.............................................. £ 600.0 6 mo. LIBOR 2.86%
April 2018...................................................... £ 300.0 6 mo. LIBOR 1.37%
______________
(a) The notional amount of multiple derivative instruments that mature within the same calendar month are shown in the
aggregate and interest rates are presented on a weighted average basis.
Equity-Related Derivative Instruments
Virgin Media Capped Calls. During 2010, we entered into conversion hedges (the Virgin Media Capped Calls) with respect
to the VM Convertible Notes, as defined and described in note 7, in order to offset a portion of the dilutive effects associated with
conversion of the VM Convertible Notes. We account for the Virgin Media Capped Calls at fair value using a binomial pricing
model and changes in fair value are reported in realized and unrealized gains or losses on derivative instruments, net, in our
consolidated statements of operations. The fair value of the Virgin Media Capped Calls as of December 31, 2013 was an asset of
£20.1 million. The Virgin Media Capped Calls mature on dates ranging from September 30, 2016 to November 10, 2016.
As further described in note 7, during the Successor period in 2013, most of the VM Convertible Notes were exchanged for
Liberty Global Class A and Class C ordinary shares and cash pursuant to the terms of the VM Convertible Notes Indenture (as
defined in note 7). Accordingly, during 2013, we settled 93.8% of the notional amount of the Virgin Media Capped Calls for cash
proceeds of $534.8 million (£353.4 million at the applicable rate).
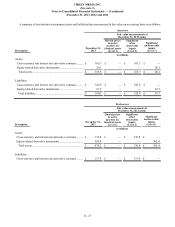
(5) Fair Value Measurements
We use the fair value method to account for our derivative instruments. The reported fair values of these derivative instruments
as of December 31, 2013 likely will not represent the value that will be paid or received upon the ultimate settlement or disposition
of these assets and liabilities. We expect that the values realized generally will be based on market conditions at the time of
settlement, which may occur at the maturity of the derivative instrument or at the time of the repayment or refinancing of the
underlying debt instrument.
GAAP provides for a fair value hierarchy that prioritizes the inputs to valuation techniques used to measure fair value into
three broad levels. Level 1 inputs are quoted market prices in active markets for identical assets or liabilities that the reporting
entity has the ability to access at the measurement date. Level 2 inputs are inputs other than quoted market prices included within
Level 1 that are observable for the asset or liability, either directly or indirectly. Level 3 inputs are unobservable inputs for the
asset or liability. We record transfers of assets or liabilities in or out of Levels 1, 2 or 3 at the beginning of the quarter during
which the transfer occurred. During 2013, no such transfers were made.
All of our Level 2 inputs (interest rate futures, swap rates and certain of the inputs for our weighted average cost of capital
calculations) and certain of our Level 3 inputs (forecasted volatilities and credit spreads) are obtained from pricing services. These
inputs, or interpolations or extrapolations thereof, are used in our internal models to calculate, among other items, yield curves,
forward interest and currency rates and weighted average cost of capital rates. In the normal course of business, we receive market
value assessments from the counterparties to our derivative contracts. Although we compare these assessments to our internal
valuations and investigate unexpected differences, we do not otherwise rely on counterparty quotes to determine the fair values
of our derivative instruments. The midpoints of applicable bid and ask ranges generally are used as inputs for our internal valuations.