Virgin Media 2013 Annual Report Download - page 110
Download and view the complete annual report
Please find page 110 of the 2013 Virgin Media annual report below. You can navigate through the pages in the report by either clicking on the pages listed below, or by using the keyword search tool below to find specific information within the annual report.-
 1
1 -
2
-
3
-
4
-
5
-
6
-
7
-
8
-
9
-
10
-
11
-
12
-
13
-
14
-
15
-
16
-
17
-
18
-
19
-
20
-
21
-
22
-
23
-
24
-
25
-
26
-
27
-
28
-
29
-
30
-
31
-
32
-
33
-
34
-
35
-
36
-
37
-
38
-
39
-
40
-
41
-
42
-
43
-
44
-
45
-
46
-
47
-
48
-
49
-
50
-
51
-
52
-
53
-
54
-
55
-
56
-
57
-
58
-
59
-
60
-
61
-
62
-
63
-
64
-
65
-
66
-
67
-
68
-
69
-
70
-
71
-
72
-
73
-
74
-
75
-
76
-
77
-
78
-
79
-
80
-
81
-
82
-
83
-
84
-
85
-
86
-
87
-
88
-
89
-
90
-
91
-
92
-
93
-
94
-
95
-
96
-
97
-
98
-
99
-
 100
100 -
 101
101 -
 102
102 -
 103
103 -
 104
104 -
 105
105 -
 106
106 -
 107
107 -
 108
108 -
 109
109 -
 110
110 -
 111
111 -
 112
112 -
 113
113 -
 114
114 -
 115
115 -
 116
116 -
 117
117 -
 118
118 -
 119
119 -
 120
120 -
121
-
122
-
123
-
124
-
125
-
126
-
127
-
128
-
129
-
130
-
131
-
132
-
133
-
134
-
135
-
136
-
137
-
138
-
139
 |
 |

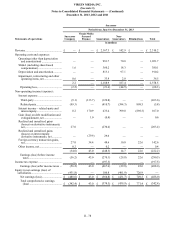
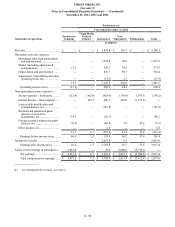
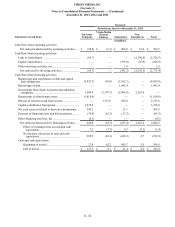
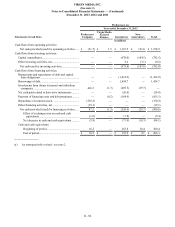
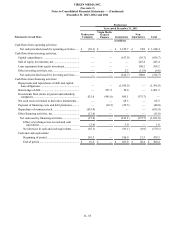
VIRGIN MEDIA INC.
(See note 1)
Notes to Consolidated Financial Statements — (Continued)
December 31, 2013, 2012 and 2011
II - 85
Predecessor
Year ended December 31, 2011
Statements of cash flows Predecessor
Company
Virgin Media
Secured
Finance Guarantors Non-
Guarantors Total
in millions
Cash flows from operating activities:
Net cash provided (used) by operating activities...... £(56.1) £ — £ 1,129.7 £ 74.8 £ 1,148.4
Cash flows from investing activities:
Capital expenditures.................................................... — — (617.0)(39.7)(656.7)
Sale of equity investments, net ................................... — — — 243.4 243.4
Loan repayment from equity investment .................... — — — 108.2 108.2
Other investing activities, net...................................... — — 2.3 (11.9)(9.6)
Net cash provided (used) by investing activities...... — — (614.7) 300.0 (314.7)
Cash flows from financing activities:
Repayments and repurchases of debt and capital
lease obligations ...................................................... — — (1,395.0) — (1,395.0)
Borrowings of debt...................................................... — 951.5 50.0 — 1,001.5
Investments from (loans to) parent and subsidiary
companies................................................................ 621.6 (941.0) 695.1 (375.7) —
Net cash received related to derivative instruments.... — — 68.3 — 68.3
Payment of financing costs and debt premiums.......... —(10.5)(29.5) — (40.0)
Repurchase of common stock ..................................... (635.0) — — — (635.0)
Other financing activities, net..................................... (13.6) — — — (13.6)
Net cash used by financing activities........................ (27.0) — (611.1)(375.7)(1,013.8)
Effect of exchange rates on cash and cash
equivalents........................................................ (2.0) — 3.0 — 1.0
Net decrease in cash and cash equivalents........... (85.1) — (93.1)(0.9)(179.1)
Cash and cash equivalents:
Beginning of period ............................................. 101.3 — 356.9 21.3 479.5
End of period........................................................ £ 16.2 £ — £ 263.8 £ 20.4 £ 300.4