Virgin Media 2013 Annual Report Download - page 79
Download and view the complete annual report
Please find page 79 of the 2013 Virgin Media annual report below. You can navigate through the pages in the report by either clicking on the pages listed below, or by using the keyword search tool below to find specific information within the annual report.-
 1
1 -
2
-
3
-
4
-
5
-
6
-
7
-
8
-
9
-
10
-
11
-
12
-
13
-
14
-
15
-
16
-
17
-
18
-
19
-
20
-
21
-
22
-
23
-
24
-
25
-
26
-
27
-
28
-
29
-
30
-
31
-
32
-
33
-
34
-
35
-
36
-
37
-
38
-
39
-
40
-
41
-
42
-
43
-
44
-
45
-
46
-
47
-
48
-
49
-
50
-
51
-
52
-
53
-
54
-
55
-
56
-
57
-
58
-
59
-
60
-
61
-
62
-
63
-
64
-
65
-
66
-
67
-
68
-
 69
69 -
 70
70 -
 71
71 -
 72
72 -
 73
73 -
 74
74 -
 75
75 -
 76
76 -
 77
77 -
 78
78 -
 79
79 -
 80
80 -
 81
81 -
 82
82 -
 83
83 -
 84
84 -
 85
85 -
 86
86 -
 87
87 -
 88
88 -
 89
89 -
90
-
91
-
92
-
93
-
94
-
95
-
96
-
97
-
98
-
99
-
100
-
101
-
102
-
103
-
104
-
105
-
106
-
107
-
108
-
109
-
110
-
111
-
112
-
113
-
114
-
115
-
116
-
117
-
118
-
119
-
120
-
121
-
122
-
123
-
124
-
125
-
126
-
127
-
128
-
129
-
130
-
131
-
132
-
133
-
134
-
135
-
136
-
137
-
138
-
139
 |
 |

VIRGIN MEDIA INC.
(See note 1)
Notes to Consolidated Financial Statements — (Continued)
December 31, 2013, 2012 and 2011
II - 54
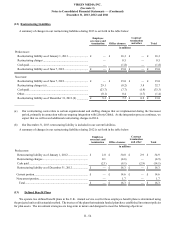
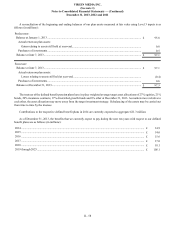
(12) Restructuring Liabilities
A summary of changes in our restructuring liabilities during 2013 is set forth in the table below:
Employee
severance and
termination Office closures
Contract
termination
and other Total
in millions
Predecessor:
Restructuring liability as of January 1, 2013............................ £ — £ 16.3 £ — £ 16.3
Restructuring charges ............................................................... — 0.5 — 0.5
Cash paid .................................................................................. —(1.8) — (1.8)
Restructuring liability as of June 7, 2013................................. £ — £ 15.0 £ — £ 15.0
Successor:
Restructuring liability as of June 7, 2013................................. £ — £ 15.0 £ — £ 15.0
Restructuring charges (a).......................................................... 29.1 (0.2) 3.8 32.7
Cash paid .................................................................................. (23.7)(7.7)(1.9)(33.3)
Other ......................................................................................... (0.1) 0.4 (1.7)(1.4)
Restructuring liability as of December 31, 2013 (b) ................ £ 5.3 £ 7.5 £ 0.2 £ 13.0
______________
(a) Our restructuring costs relate to certain organizational and staffing changes that we implemented during the Successor
period, primarily in connection with our ongoing integration with Liberty Global. As the integration process continues, we
expect that we will record additional restructuring charges in 2014.
(b) Our December 31, 2013 restructuring liability is included in our current liabilities.
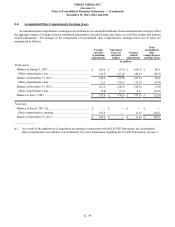
A summary of changes in our restructuring liabilities during 2012 is set forth in the table below:
Employee
severance and
termination Office closures
Contract
termination
and other Total
in millions
Predecessor:
Restructuring liability as of January 1, 2012............................ £ 2.0 £ 30.0 £ 2.9 £ 34.9
Restructuring charges ............................................................... 0.1 (4.6) — (4.5)
Cash paid .................................................................................. (2.1)(9.1)(2.9)(14.1)
Restructuring liability as of December 31, 2012...................... £ — £ 16.3 £ — £ 16.3
Current portion........................................................................... £ — £ 14.6 £ — £ 14.6
Noncurrent portion..................................................................... — 1.7 — 1.7
Total........................................................................................ £ — £ 16.3 £ — £ 16.3
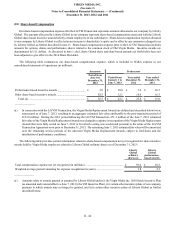
(13) Defined Benefit Plans
We operate two defined benefit plans in the U.K. Annual service cost for these employee benefit plans is determined using
the projected unit credit actuarial method. The trustees of the plans that maintain funded plans have established investment policies
for plan assets. The investment strategies are long-term in nature and designed to meet the following objectives: