Virgin Media 2013 Annual Report Download - page 115
Download and view the complete annual report
Please find page 115 of the 2013 Virgin Media annual report below. You can navigate through the pages in the report by either clicking on the pages listed below, or by using the keyword search tool below to find specific information within the annual report.-
 1
1 -
2
-
3
-
4
-
5
-
6
-
7
-
8
-
9
-
10
-
11
-
12
-
13
-
14
-
15
-
16
-
17
-
18
-
19
-
20
-
21
-
22
-
23
-
24
-
25
-
26
-
27
-
28
-
29
-
30
-
31
-
32
-
33
-
34
-
35
-
36
-
37
-
38
-
39
-
40
-
41
-
42
-
43
-
44
-
45
-
46
-
47
-
48
-
49
-
50
-
51
-
52
-
53
-
54
-
55
-
56
-
57
-
58
-
59
-
60
-
61
-
62
-
63
-
64
-
65
-
66
-
67
-
68
-
69
-
70
-
71
-
72
-
73
-
74
-
75
-
76
-
77
-
78
-
79
-
80
-
81
-
82
-
83
-
84
-
85
-
86
-
87
-
88
-
89
-
90
-
91
-
92
-
93
-
94
-
95
-
96
-
97
-
98
-
99
-
100
-
101
-
102
-
103
-
104
-
 105
105 -
 106
106 -
 107
107 -
 108
108 -
 109
109 -
 110
110 -
 111
111 -
 112
112 -
 113
113 -
 114
114 -
 115
115 -
 116
116 -
 117
117 -
 118
118 -
 119
119 -
 120
120 -
 121
121 -
 122
122 -
 123
123 -
 124
124 -
 125
125 -
126
-
127
-
128
-
129
-
130
-
131
-
132
-
133
-
134
-
135
-
136
-
137
-
138
-
139
 |
 |

III - 5
Results of Operations
This section provides an analysis of our results of operations for the years ended December 31, 2013, 2012 and 2011.
Discussion and Analysis
2013 compared to 2012
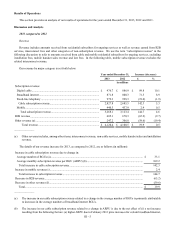
Revenue
Revenue includes amounts received from residential subscribers for ongoing services as well as revenue earned from B2B
services, interconnect fees and other categories of non-subscription revenue. We use the term “subscription revenue” in the
following discussion to refer to amounts received from cable and mobile residential subscribers for ongoing services, excluding
installation fees, mobile handset sales revenue and late fees. In the following table, mobile subscription revenue excludes the
related interconnect revenue.
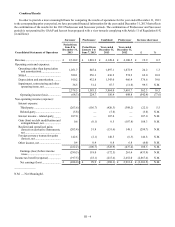
Our revenue by major category is set forth below:
Year ended December 31, Increase (decrease)
2013 2012 £ %
in millions
Subscription revenue:
Digital cable.............................................................................................. £ 976.7 £ 886.9 £ 89.8 10.1
Broadband internet.................................................................................... 871.8 800.3 71.5 8.9
Fixed-line telephony ................................................................................. 979.3 998.3 (19.0)(1.9)
Cable subscription revenue..................................................................... 2,827.8 2,685.5 142.3 5.3
Mobile....................................................................................................... 440.3 437.9 2.4 0.5
Total subscription revenue.................................................................... 3,268.1 3,123.4 144.7 4.6
B2B revenue................................................................................................ 605.1 670.3 (65.2)(9.7)
Other revenue (a)......................................................................................... 247.2 306.8 (59.6)(19.4)
Total revenue...................................................................................... £ 4,120.4 £ 4,100.5 £ 19.9 0.5
______________
(a) Other revenue includes, among other items, interconnect revenue, non-cable services, mobile handset sales and installation
revenue.
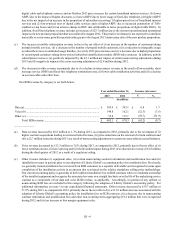
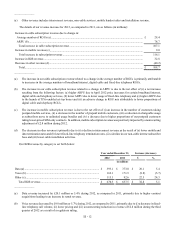
The details of our revenue increase for 2013, as compared to 2012, are as follows (in millions):
Increase in cable subscription revenue due to change in:
Average number of RGUs (a)................................................................................................................................. £ 33.1
Average monthly subscription revenue per RGU (ARPU) (b)............................................................................... 109.2
Total increase in cable subscription revenue....................................................................................................... 142.3
Increase in mobile revenue (c).................................................................................................................................. 2.4
Total increase in subscription revenue................................................................................................................ 144.7
Decrease in B2B revenue.......................................................................................................................................... (65.2)
Decrease in other revenue (d)................................................................................................................................... (59.6)
Total..................................................................................................................................................................... £ 19.9
______________
(a) The increase in our cable subscription revenue related to a change in the average number of RGUs is primarily attributable
to increases in the average numbers of broadband internet RGUs.
(b) The increase in our cable subscription revenue related to a change in ARPU is due to the net effect of (i) a net increase
resulting from the following factors: (a) higher ARPU due to February 2013 price increases for certain broadband internet,