Virgin Media 2013 Annual Report Download - page 81
Download and view the complete annual report
Please find page 81 of the 2013 Virgin Media annual report below. You can navigate through the pages in the report by either clicking on the pages listed below, or by using the keyword search tool below to find specific information within the annual report.-
 1
1 -
2
-
3
-
4
-
5
-
6
-
7
-
8
-
9
-
10
-
11
-
12
-
13
-
14
-
15
-
16
-
17
-
18
-
19
-
20
-
21
-
22
-
23
-
24
-
25
-
26
-
27
-
28
-
29
-
30
-
31
-
32
-
33
-
34
-
35
-
36
-
37
-
38
-
39
-
40
-
41
-
42
-
43
-
44
-
45
-
46
-
47
-
48
-
49
-
50
-
51
-
52
-
53
-
54
-
55
-
56
-
57
-
58
-
59
-
60
-
61
-
62
-
63
-
64
-
65
-
66
-
67
-
68
-
69
-
70
-
 71
71 -
 72
72 -
 73
73 -
 74
74 -
 75
75 -
 76
76 -
 77
77 -
 78
78 -
 79
79 -
 80
80 -
 81
81 -
 82
82 -
 83
83 -
 84
84 -
 85
85 -
 86
86 -
 87
87 -
 88
88 -
 89
89 -
 90
90 -
 91
91 -
92
-
93
-
94
-
95
-
96
-
97
-
98
-
99
-
100
-
101
-
102
-
103
-
104
-
105
-
106
-
107
-
108
-
109
-
110
-
111
-
112
-
113
-
114
-
115
-
116
-
117
-
118
-
119
-
120
-
121
-
122
-
123
-
124
-
125
-
126
-
127
-
128
-
129
-
130
-
131
-
132
-
133
-
134
-
135
-
136
-
137
-
138
-
139
 |
 |

VIRGIN MEDIA INC.
(See note 1)
Notes to Consolidated Financial Statements — (Continued)
December 31, 2013, 2012 and 2011
II - 56
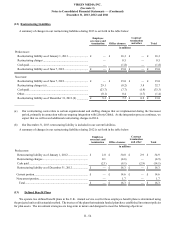
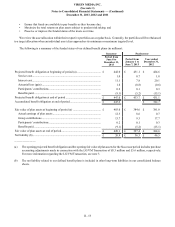
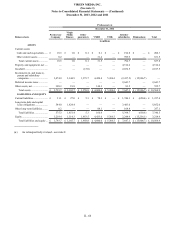
The change in the amount of net actuarial gain (loss) not yet recognized as a component of net periodic pension costs in our
consolidated statements of operations is as follows:
Before-tax
amount Tax benefit Net-of-tax
amount
in millions
Predecessor:
Balance at January 1, 2011.......................................................................................... £(73.5) £ 6.6 £ (66.9)
Net actuarial loss....................................................................................................... (20.6) — (20.6)
Balance at December 31, 2011.................................................................................... (94.1) 6.6 (87.5)
Net actuarial loss....................................................................................................... (14.3) 3.3 (11.0)
Balance at December 31, 2012 ................................................................................... (108.4) 9.9 (98.5)
Net actuarial gain...................................................................................................... 0.8 (0.2) 0.6
Balance at June 7, 2013............................................................................................... £(107.6) £ 9.7 £ (97.9)
Successor:
Balance at June 8, 2013............................................................................................... £ — £ — £ —
Net actuarial loss....................................................................................................... (2.0) 0.4 (1.6)
Balance at December 31, 2013 ................................................................................... £(2.0) £ 0.4 £ (1.6)
We do not expect to record any actuarial gains or losses in our 2014 consolidated statement of operations.
The measurement dates used to determine our defined benefit plan assumptions were December 31, 2013, June 7, 2013 and
December 31, 2012. The actuarial assumptions used to compute the net periodic pension cost are based on information available
as of the beginning of the period, specifically market interest rates, past experience and management’s best estimate of future
economic conditions. Changes in these assumptions may impact future benefit costs and obligations. In computing future costs
and obligations, the subsidiaries must make assumptions about such items as employee mortality and turnover, expected salary
and wage increases, discount rate, expected long-term rate of return on plan assets and expected future cost increases.
The expected rates of return on the assets of the plans are the long-term rates of return the subsidiaries expect to earn on their
trust assets. The rates of return are determined by the investment composition of the plan assets and the long-term risk and return
forecast for each asset category. The forecasts for each asset class are generated using historical information as well as an analysis
of current and expected market conditions. The expected risk and return characteristics for each asset class are reviewed annually
and revised, as necessary, to reflect changes in the financial markets. To compute the expected return on plan assets, the subsidiaries
apply an expected rate of return to the fair value of the plan assets.
The weighted average assumptions used in determining benefit obligations and net periodic pension cost are as follows:
December 31,
2013 2012 2011
Expected rate of salary increase ......................................................................................... 3.9% 3.5% 4.0%
Discount rate....................................................................................................................... 4.5% 4.8% 5.5%
Expected rate of return on plan assets ................................................................................ 6.1% 5.4% 6.3%