Virgin Media 2013 Annual Report Download - page 121
Download and view the complete annual report
Please find page 121 of the 2013 Virgin Media annual report below. You can navigate through the pages in the report by either clicking on the pages listed below, or by using the keyword search tool below to find specific information within the annual report.-
 1
1 -
2
-
3
-
4
-
5
-
6
-
7
-
8
-
9
-
10
-
11
-
12
-
13
-
14
-
15
-
16
-
17
-
18
-
19
-
20
-
21
-
22
-
23
-
24
-
25
-
26
-
27
-
28
-
29
-
30
-
31
-
32
-
33
-
34
-
35
-
36
-
37
-
38
-
39
-
40
-
41
-
42
-
43
-
44
-
45
-
46
-
47
-
48
-
49
-
50
-
51
-
52
-
53
-
54
-
55
-
56
-
57
-
58
-
59
-
60
-
61
-
62
-
63
-
64
-
65
-
66
-
67
-
68
-
69
-
70
-
71
-
72
-
73
-
74
-
75
-
76
-
77
-
78
-
79
-
80
-
81
-
82
-
83
-
84
-
85
-
86
-
87
-
88
-
89
-
90
-
91
-
92
-
93
-
94
-
95
-
96
-
97
-
98
-
99
-
100
-
101
-
102
-
103
-
104
-
105
-
106
-
107
-
108
-
109
-
110
-
 111
111 -
 112
112 -
 113
113 -
 114
114 -
 115
115 -
 116
116 -
 117
117 -
 118
118 -
 119
119 -
 120
120 -
 121
121 -
 122
122 -
 123
123 -
 124
124 -
 125
125 -
 126
126 -
 127
127 -
 128
128 -
 129
129 -
 130
130 -
 131
131 -
132
-
133
-
134
-
135
-
136
-
137
-
138
-
139
 |
 |

III - 11
by the positive impact of certain permanent differences between the financial and tax accounting treatment of interest and other
items.
The income tax benefit during 2012 differs from the expected income tax expense of £91.5 million (based on the U.S. federal
income tax rate of 35%) due primarily to the positive impacts of (i) a net decrease in valuation allowances of £2,675.7 million
primarily related to the reversal of valuation allowances on certain of our U.K. deferred tax assets as these tax assets were deemed
realizable in the period and (ii) certain permanent differences between the financial and tax accounting treatment of interest and
other items. The reversal of the valuation allowance is attributable to the accumulation of positive evidence on the realizability
of these deferred tax assets, including (i) pre-tax income generated for the each of the two years ended December 31, 2012, (ii)
capital allowances and net operating losses that do not expire, (iii) improved financial performance and (iv) our then forecasted
projections of future taxable income, which, as of the fourth quarter of 2012, outweighed the negative evidence, which was primarily
a history of taxable losses in periods prior to 2011.
For additional information concerning our income taxes, see note 8 to our consolidated financial statements.
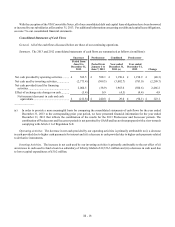
Net earnings (loss)
During 2013 and 2012, we reported net earnings (loss) of (£388.1 million) and £2,913.4 million, respectively, including (i)
operating income of £156.4 million and £698.8 million, respectively, (ii) non-operating expense of £328.9 million and £437.4
million, respectively, and (iii) income tax benefit (expense) of (£215.6 million) and £2,652.0 million, respectively.
Gains or losses associated with items such as (i) changes in the fair values of derivative instruments and (ii) movements in
foreign currency exchange rates are subject to a high degree of volatility, and as such, any gains from these sources do not represent
reliable sources of income. In the absence of significant gains in the future from these sources or from other non-operating items,
our ability to achieve earnings from continuing operations is largely dependent on our ability to increase our aggregate operating
cash flow to a level that more than offsets the aggregate amount of our (a) share-based compensation expense, (b) depreciation
and amortization, (c) impairment, restructuring and other operating items, net, (d) interest expense, (e) other net non-operating
expenses and (f) income tax expenses. Operating cash flow is defined as revenue less operating and SG&A expenses (excluding
share-based compensation, depreciation and amortization and impairment, restructuring and other operating items).
Due largely to the fact that Liberty Global generally seeks to cause our company to maintain our debt at levels that result in
a consolidated debt balance that is between four and five times our consolidated operating cash flow, as discussed under Liquidity
and Capital Resources - Capitalization below, we expect that we will continue to report significant levels of interest expense for
the foreseeable future. For information with respect to certain trends that may affect our operating results in future periods, see
the discussion under Overview above. For information concerning the reasons for changes in specific line items in our consolidated
statements of operations, see the above discussion.
2012 compared to 2011
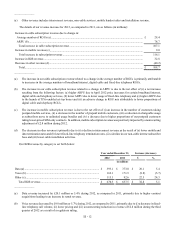
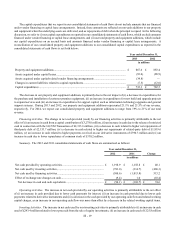
Revenue
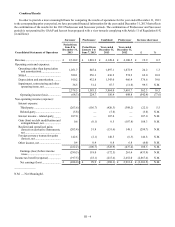
Our revenue by major category is set forth below:
Year ended December 31, Increase (decrease)
2012 2011 £ %
in millions
Subscription revenue:
Digital cable.............................................................................................. £ 886.9 £ 819.9 £ 67.0 8.2
Broadband internet.................................................................................... 800.3 729.0 71.3 9.8
Fixed-line telephony ................................................................................. 998.3 1,029.5 (31.2)(3.0)
Cable subscription revenue..................................................................... 2,685.5 2,578.4 107.1 4.2
Mobile....................................................................................................... 437.9 428.9 9.0 2.1
Total subscription revenue.................................................................... 3,123.4 3,007.3 116.1 3.9
B2B revenue................................................................................................ 670.3 637.5 32.8 5.1
Other revenue (a)......................................................................................... 306.8 347.0 (40.2)(11.6)
Total revenue...................................................................................... £ 4,100.5 £ 3,991.8 £ 108.7 2.7