Virgin Media 2013 Annual Report Download - page 128
Download and view the complete annual report
Please find page 128 of the 2013 Virgin Media annual report below. You can navigate through the pages in the report by either clicking on the pages listed below, or by using the keyword search tool below to find specific information within the annual report.-
 1
1 -
2
-
3
-
4
-
5
-
6
-
7
-
8
-
9
-
10
-
11
-
12
-
13
-
14
-
15
-
16
-
17
-
18
-
19
-
20
-
21
-
22
-
23
-
24
-
25
-
26
-
27
-
28
-
29
-
30
-
31
-
32
-
33
-
34
-
35
-
36
-
37
-
38
-
39
-
40
-
41
-
42
-
43
-
44
-
45
-
46
-
47
-
48
-
49
-
50
-
51
-
52
-
53
-
54
-
55
-
56
-
57
-
58
-
59
-
60
-
61
-
62
-
63
-
64
-
65
-
66
-
67
-
68
-
69
-
70
-
71
-
72
-
73
-
74
-
75
-
76
-
77
-
78
-
79
-
80
-
81
-
82
-
83
-
84
-
85
-
86
-
87
-
88
-
89
-
90
-
91
-
92
-
93
-
94
-
95
-
96
-
97
-
98
-
99
-
100
-
101
-
102
-
103
-
104
-
105
-
106
-
107
-
108
-
109
-
110
-
111
-
112
-
113
-
114
-
115
-
116
-
117
-
 118
118 -
 119
119 -
 120
120 -
 121
121 -
 122
122 -
 123
123 -
 124
124 -
 125
125 -
 126
126 -
 127
127 -
 128
128 -
 129
129 -
 130
130 -
 131
131 -
 132
132 -
 133
133 -
 134
134 -
 135
135 -
 136
136 -
 137
137 -
 138
138 -
139
 |
 |

III - 18
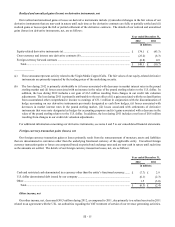
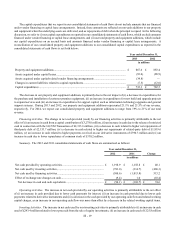
With the exception of the VM Convertible Notes, all of our consolidated debt and capital lease obligations have been borrowed
or incurred by our subsidiaries at December 31, 2013. For additional information concerning our debt and capital lease obligations,
see note 7 to our consolidated financial statements.
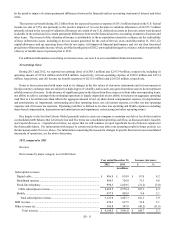
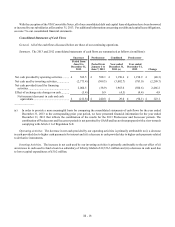
Consolidated Statements of Cash Flows
General. All of the cash flows discussed below are those of our continuing operations.
Summary. The 2013 and 2012 consolidated statements of cash flows are summarized as follows (in millions):
Successor Predecessor Combined Predecessor
Period from
June 8 to
December 31,
2013
Period from
January 1 to
June 7, 2013
Year ended
December 31,
2013 (a)
Year ended
December 31,
2012 Change
Net cash provided by operating activities ......... £ 562.5 £ 588.1 £ 1,150.6 £ 1,198.9 £ (48.3)
Net cash used by investing activities................. (2,773.4) (309.3)(3,082.7)(783.0)(2,299.7)
Net cash provided (used) by financing
activities......................................................... 2,004.5 (38.9) 1,965.6 (500.6) 2,466.2
Effect of exchange rate changes on cash........... (5.4) 0.9 (4.5)(9.4) 4.9
Net increase (decrease) in cash and cash
equivalents.................................................. £ (211.8) £ 240.8 £ 29.0 £ (94.1) £ 123.1
______________
(a) In order to provide a more meaningful basis for comparing the consolidated statements of cash flows for the year ended
December 31, 2013 to the corresponding prior year period, we have presented financial information for the year ended
December 31, 2013 that reflects the combination of the results for the 2013 Predecessor and Successor periods. The
combination of Predecessor and Successor periods is not permitted by GAAP and has not been prepared with a view towards
complying with Article 11 of Regulation S-X.
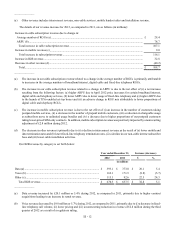
Operating Activities. The decrease in net cash provided by our operating activities is primarily attributable to (i) a decrease
in cash provided due to higher cash payments for interest and (ii) a decrease in cash provided due to higher cash payments related
to derivative instruments.
Investing Activities. The increase in net cash used by our investing activities is primarily attributable to the net effect of (i)
an increase in cash used to fund a loan to a subsidiary of Liberty Global of £2,356.3 million and (ii) a decrease in cash used due
to lower capital expenditures of £50.2 million.