Virgin Media 2013 Annual Report Download - page 62
Download and view the complete annual report
Please find page 62 of the 2013 Virgin Media annual report below. You can navigate through the pages in the report by either clicking on the pages listed below, or by using the keyword search tool below to find specific information within the annual report.-
 1
1 -
2
-
3
-
4
-
5
-
6
-
7
-
8
-
9
-
10
-
11
-
12
-
13
-
14
-
15
-
16
-
17
-
18
-
19
-
20
-
21
-
22
-
23
-
24
-
25
-
26
-
27
-
28
-
29
-
30
-
31
-
32
-
33
-
34
-
35
-
36
-
37
-
38
-
39
-
40
-
41
-
42
-
43
-
44
-
45
-
46
-
47
-
48
-
49
-
50
-
51
-
 52
52 -
 53
53 -
 54
54 -
 55
55 -
 56
56 -
 57
57 -
 58
58 -
 59
59 -
 60
60 -
 61
61 -
 62
62 -
 63
63 -
 64
64 -
 65
65 -
 66
66 -
 67
67 -
 68
68 -
 69
69 -
 70
70 -
 71
71 -
 72
72 -
73
-
74
-
75
-
76
-
77
-
78
-
79
-
80
-
81
-
82
-
83
-
84
-
85
-
86
-
87
-
88
-
89
-
90
-
91
-
92
-
93
-
94
-
95
-
96
-
97
-
98
-
99
-
100
-
101
-
102
-
103
-
104
-
105
-
106
-
107
-
108
-
109
-
110
-
111
-
112
-
113
-
114
-
115
-
116
-
117
-
118
-
119
-
120
-
121
-
122
-
123
-
124
-
125
-
126
-
127
-
128
-
129
-
130
-
131
-
132
-
133
-
134
-
135
-
136
-
137
-
138
-
139
 |
 |

VIRGIN MEDIA INC.
(See note 1)
Notes to Consolidated Financial Statements — (Continued)
December 31, 2013, 2012 and 2011
II - 37
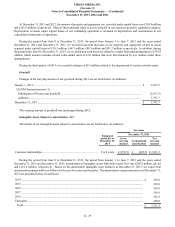
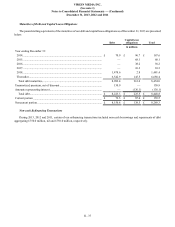
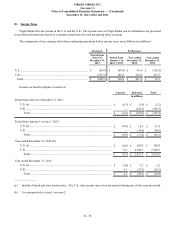
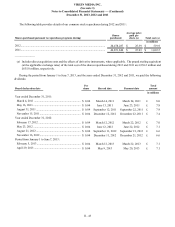
Maturities of Debt and Capital Lease Obligations
The pound sterling equivalents of the maturities of our debt and capital lease obligations as of December 31, 2013 are presented
below:
Debt Capital lease
obligations Total
in millions
Year ending December 31:
2014............................................................................................................... £ 70.9 £ 96.7 £ 167.6
2015............................................................................................................... — 68.1 68.1
2016............................................................................................................... — 38.2 38.2
2017............................................................................................................... — 10.3 10.3
2018............................................................................................................... 1,478.6 2.8 1,481.4
Thereafter...................................................................................................... 6,542.9 145.5 6,688.4
Total debt maturities.................................................................................... 8,092.4 361.6 8,454.0
Unamortized premium, net of discount........................................................... 130.9 — 130.9
Amounts representing interest......................................................................... —(136.1)(136.1)
Total debt..................................................................................................... £ 8,223.3 £ 225.5 £ 8,448.8
Current portion ................................................................................................ £ 72.5 £ 87.0 £ 159.5
Noncurrent portion .......................................................................................... £ 8,150.8 £ 138.5 £ 8,289.3
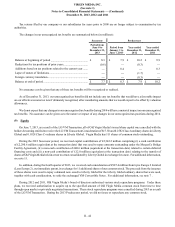
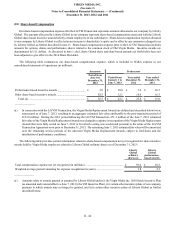
Non-cash Refinancing Transactions
During 2013, 2012 and 2011, certain of our refinancing transactions included non-cash borrowings and repayments of debt
aggregating £750.0 million, nil and £750.0 million, respectively.