Virgin Media 2013 Annual Report Download - page 124
Download and view the complete annual report
Please find page 124 of the 2013 Virgin Media annual report below. You can navigate through the pages in the report by either clicking on the pages listed below, or by using the keyword search tool below to find specific information within the annual report.-
 1
1 -
2
-
3
-
4
-
5
-
6
-
7
-
8
-
9
-
10
-
11
-
12
-
13
-
14
-
15
-
16
-
17
-
18
-
19
-
20
-
21
-
22
-
23
-
24
-
25
-
26
-
27
-
28
-
29
-
30
-
31
-
32
-
33
-
34
-
35
-
36
-
37
-
38
-
39
-
40
-
41
-
42
-
43
-
44
-
45
-
46
-
47
-
48
-
49
-
50
-
51
-
52
-
53
-
54
-
55
-
56
-
57
-
58
-
59
-
60
-
61
-
62
-
63
-
64
-
65
-
66
-
67
-
68
-
69
-
70
-
71
-
72
-
73
-
74
-
75
-
76
-
77
-
78
-
79
-
80
-
81
-
82
-
83
-
84
-
85
-
86
-
87
-
88
-
89
-
90
-
91
-
92
-
93
-
94
-
95
-
96
-
97
-
98
-
99
-
100
-
101
-
102
-
103
-
104
-
105
-
106
-
107
-
108
-
109
-
110
-
111
-
112
-
113
-
 114
114 -
 115
115 -
 116
116 -
 117
117 -
 118
118 -
 119
119 -
 120
120 -
 121
121 -
 122
122 -
 123
123 -
 124
124 -
 125
125 -
 126
126 -
 127
127 -
 128
128 -
 129
129 -
 130
130 -
 131
131 -
 132
132 -
 133
133 -
 134
134 -
135
-
136
-
137
-
138
-
139
 |
 |

III - 14
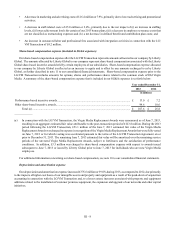
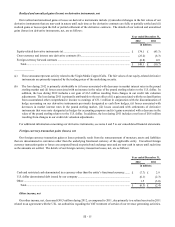
Share-based compensation expense (included in SG&A expenses)
Share-based compensation expense prior to the LG/VM Transaction includes amounts for options, shares and performance
shares related to the common stock of Old Virgin Media. A summary of the share-based compensation expense that is included
in our SG&A expenses is set forth below:
Year ended December 31,
2012 2011
in millions
Performance-based incentive awards ..................................................................................................... £ 7.2 £ 10.7
Other share-based incentive awards ....................................................................................................... 18.6 16.3
Total................................................................................................................................................. £ 25.8 £ 27.0
For additional information concerning our share-based compensation, see note 10 to our consolidated financial statements.
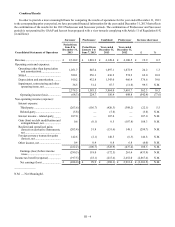
Depreciation and amortization expense
Our depreciation and amortization expense decreased £80.0 million or 7.6% during 2012, as compared to 2011, due primarily
to the net impact of (i) a decrease in amortization expense as a result of intangible assets becoming fully amortized in 2011 and
(ii) an increase associated with property and equipment additions related to the installation of customer premises equipment, the
expansion and upgrade of our networks and other capital initiatives.
Impairment, restructuring and other operating items, net
We recognized impairment, restructuring and other operating charges (credits) of (£11.8 million) and £6.8 million during 2012
and 2011, respectively. The 2012 amount includes a net gain of £12.5 million related to the termination of a capital lease during
the second quarter of 2012. The 2011 amount primarily relates to employee termination and contract and lease exit costs.
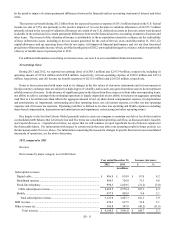
Interest expense – third-party
Our third-party interest expense decreased £42.2 million or 9.6% during 2012, as compared to 2011, due primarily to (i) lower
average outstanding third-party debt balances, (ii) lower weighted average interest rates and (iii) a decrease in interest expense
due to the effect of interest rate swaps and cross-currency interest rate swaps that were designated as accounting hedges. As
described in note 4 to our consolidated financial statements, we applied hedge accounting to certain of our derivative instruments
prior to the LG/VM Transaction.
For additional information regarding our outstanding third-party indebtedness, see note 7 to our consolidated financial
statements.
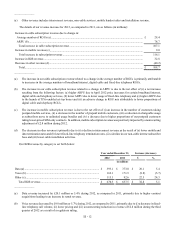
Gain (loss) on debt modification and extinguishment, net
We recognized losses on debt modification and extinguishment, net, of £187.8 million and £47.2 million during 2012 and
2011.
The loss during 2012 relates to the redemption of (i) $1,350.0 million (£814.9 million) principal amount of the 9.5% Senior
Notes, (ii) $92.9 million (£56.1 million) principal amount of the 2019 VM Dollar Senior Notes, (iii) €180.0 million (£149.8 million)
principal amount of the 9.5% Senior Notes and (iv) £96.5 million principal amount of the 2019 VM Sterling Senior Notes. In
connection with these transactions, we recognized losses on debt extinguishment of £187.8 million representing (i) premiums paid
of £152.1 million, (ii) the write-off of unamortized original issue discounts of £22.6 million and (iii) the write-off of £13.1 million
of deferred financing costs.
The loss during 2011 relates to the redemption of an existing senior credit facility and $550.0 million (£332.0 million) principal
amount of 9.125% senior notes. In connection with these transactions, we recognized losses on debt extinguishment of £47.2
million representing the write-off of £30.7 million of deferred financing costs and premiums paid of £16.5 million.