Virgin Media 2013 Annual Report Download - page 65
Download and view the complete annual report
Please find page 65 of the 2013 Virgin Media annual report below. You can navigate through the pages in the report by either clicking on the pages listed below, or by using the keyword search tool below to find specific information within the annual report.-
 1
1 -
2
-
3
-
4
-
5
-
6
-
7
-
8
-
9
-
10
-
11
-
12
-
13
-
14
-
15
-
16
-
17
-
18
-
19
-
20
-
21
-
22
-
23
-
24
-
25
-
26
-
27
-
28
-
29
-
30
-
31
-
32
-
33
-
34
-
35
-
36
-
37
-
38
-
39
-
40
-
41
-
42
-
43
-
44
-
45
-
46
-
47
-
48
-
49
-
50
-
51
-
52
-
53
-
54
-
 55
55 -
 56
56 -
 57
57 -
 58
58 -
 59
59 -
 60
60 -
 61
61 -
 62
62 -
 63
63 -
 64
64 -
 65
65 -
 66
66 -
 67
67 -
 68
68 -
 69
69 -
 70
70 -
 71
71 -
 72
72 -
 73
73 -
 74
74 -
 75
75 -
76
-
77
-
78
-
79
-
80
-
81
-
82
-
83
-
84
-
85
-
86
-
87
-
88
-
89
-
90
-
91
-
92
-
93
-
94
-
95
-
96
-
97
-
98
-
99
-
100
-
101
-
102
-
103
-
104
-
105
-
106
-
107
-
108
-
109
-
110
-
111
-
112
-
113
-
114
-
115
-
116
-
117
-
118
-
119
-
120
-
121
-
122
-
123
-
124
-
125
-
126
-
127
-
128
-
129
-
130
-
131
-
132
-
133
-
134
-
135
-
136
-
137
-
138
-
139
 |
 |

VIRGIN MEDIA INC.
(See note 1)
Notes to Consolidated Financial Statements — (Continued)
December 31, 2013, 2012 and 2011
II - 40
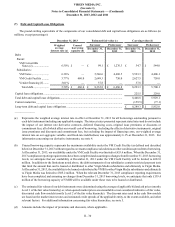
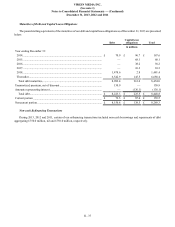
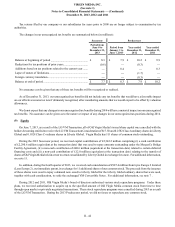
The tax effects of temporary differences that give rise to significant portions of the deferred tax assets and deferred tax liabilities
are presented below (in millions):
Successor Predecessor
December 31,
2013 December 31,
2012 (a)
Deferred tax assets:
Net operating loss........................................................................................................................ £ 660.6 £ 702.4
Capital loss carryforwards .......................................................................................................... 2,422.6 2,786.1
Debt............................................................................................................................................. 152.8 —
Property and equipment, net ....................................................................................................... 1,931.6 2,176.0
Other future deductible amounts................................................................................................. 52.2 78.8
Deferred tax assets ................................................................................................................. 5,219.8 5,743.3
Valuation allowance.................................................................................................................... (2,866.6)(2,932.9)
Deferred tax assets, net of valuation allowance ................................................................ 2,353.2 2,810.4
Deferred tax liabilities:
Property and equipment, net ....................................................................................................... (427.2)(83.2)
Intangible assets.......................................................................................................................... (559.2) —
Other future taxable amounts...................................................................................................... (11.8)(27.4)
Deferred tax liabilities............................................................................................................ (998.2)(110.6)
Net deferred tax asset ........................................................................................................... £ 1,355.0 £ 2,699.8
_______________
(a) As retrospectively revised - see note 2.
Our deferred income tax valuation allowance increased £36.5 million during the Predecessor period from January 1 to June
7, 2013 and decreased £102.8 million during the Successor period from June 8 to December 31, 2013. The increase during the
Predecessor period from January 1 to June 7, 2013 reflects the effect of (i) the net tax expense related to our continuing operations
of £29.8 million and (ii) other individually insignificant items. The decrease during the Successor period from June 8 to
December 31, 2013 reflects the net effect of (i) changes in our corporate income tax rate, (ii) acquisition accounting associated
with the LG/VM Transaction, (iii) the net tax expense related to our continuing operations of £28.8 million and (iv) other individually
insignificant items.
At December 31, 2013, we had property and equipment on which future U.K. tax deductions can be claimed of £13.4 billion.
The maximum amount of these “capital allowances” that can be claimed in any one year is 18% of the remaining balance, after
additions, disposals and prior claims. The tax effects of these capital allowances are included in the 2013 deferred tax assets related
to property and equipment, net, in the above table.
At December 31, 2013, our excess tax benefits aggregated £12.5 million. These excess tax benefits, which represent tax
deductions in excess of the financial reporting expense for share-based compensation, will not be recognized for financial reporting
purposes until such time as these tax benefits can be realized as a reduction of income taxes payable. The tax effect of these excess
tax benefits are not included in the above table.