Virgin Media 2013 Annual Report Download - page 68
Download and view the complete annual report
Please find page 68 of the 2013 Virgin Media annual report below. You can navigate through the pages in the report by either clicking on the pages listed below, or by using the keyword search tool below to find specific information within the annual report.-
 1
1 -
2
-
3
-
4
-
5
-
6
-
7
-
8
-
9
-
10
-
11
-
12
-
13
-
14
-
15
-
16
-
17
-
18
-
19
-
20
-
21
-
22
-
23
-
24
-
25
-
26
-
27
-
28
-
29
-
30
-
31
-
32
-
33
-
34
-
35
-
36
-
37
-
38
-
39
-
40
-
41
-
42
-
43
-
44
-
45
-
46
-
47
-
48
-
49
-
50
-
51
-
52
-
53
-
54
-
55
-
56
-
57
-
 58
58 -
 59
59 -
 60
60 -
 61
61 -
 62
62 -
 63
63 -
 64
64 -
 65
65 -
 66
66 -
 67
67 -
 68
68 -
 69
69 -
 70
70 -
 71
71 -
 72
72 -
 73
73 -
 74
74 -
 75
75 -
 76
76 -
 77
77 -
 78
78 -
79
-
80
-
81
-
82
-
83
-
84
-
85
-
86
-
87
-
88
-
89
-
90
-
91
-
92
-
93
-
94
-
95
-
96
-
97
-
98
-
99
-
100
-
101
-
102
-
103
-
104
-
105
-
106
-
107
-
108
-
109
-
110
-
111
-
112
-
113
-
114
-
115
-
116
-
117
-
118
-
119
-
120
-
121
-
122
-
123
-
124
-
125
-
126
-
127
-
128
-
129
-
130
-
131
-
132
-
133
-
134
-
135
-
136
-
137
-
138
-
139
 |
 |

VIRGIN MEDIA INC.
(See note 1)
Notes to Consolidated Financial Statements — (Continued)
December 31, 2013, 2012 and 2011
II - 43
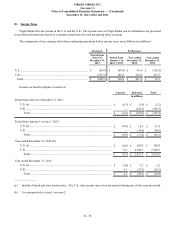
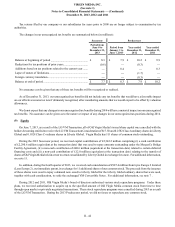
The following table provides details of our common stock repurchases during 2012 and 2011:
Shares purchased pursuant to repurchase programs during: Shares
purchased
Average price
paid per
share (a) Total cost (a)
in millions
2012...................................................................................................................... 20,478,287 $ 25.39 $ 519.9
2011...................................................................................................................... 40,851,840 $ 25.03 $ 1,022.5
______________
(a) Includes direct acquisition costs and the effects of derivative instruments, where applicable. The pound sterling equivalent
(at the applicable exchange rates) of the total cost of the shares repurchased during 2012 and 2011 are £330.2 million and
£635.0 million, respectively.
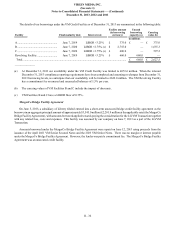
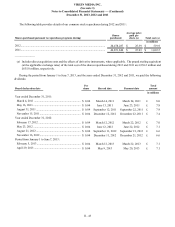
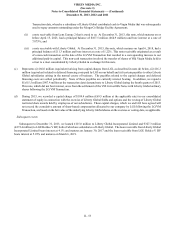
During the period from January 1 to June 7, 2013, and the years ended December 31, 2012 and 2011, we paid the following
dividends:
Board declaration date Per
share Record date Payment date Total
amount
in millions
Year ended December 31, 2011:
March 4, 2011 ................................................................. $ 0.04 March 14, 2011 March 24, 2011 £ 8.0
May 16, 2011................................................................... $ 0.04 June 13, 2011 June 23, 2011 £ 7.8
August 31, 2011.............................................................. $ 0.04 September 12, 2011 September 22, 2011 £ 7.9
November 15, 2011......................................................... $ 0.04 December 12, 2011 December 22, 2011 £ 7.4
Year ended December 31, 2012:
February 17, 2012 ........................................................... $ 0.04 March 12, 2012 March 22, 2012 £ 7.0
May 23, 2012 .................................................................. $ 0.04 June 12, 2012 June 22, 2012 £ 7.1
August 21, 2012.............................................................. $ 0.04 September 11, 2012 September 21, 2012 £ 6.6
November 16, 2012......................................................... $ 0.04 December 11, 2012 December 21, 2012 £ 6.6
Period from January 1 to June 7, 2013:
February 5, 2013 ............................................................. $ 0.04 March 12, 2013 March 22, 2013 £ 7.1
April 29, 2013 ................................................................. $ 0.04 May 9, 2013 May 20, 2013 £ 7.1