Virgin Media 2013 Annual Report Download - page 33
Download and view the complete annual report
Please find page 33 of the 2013 Virgin Media annual report below. You can navigate through the pages in the report by either clicking on the pages listed below, or by using the keyword search tool below to find specific information within the annual report.-
 1
1 -
2
-
3
-
4
-
5
-
6
-
7
-
8
-
9
-
10
-
11
-
12
-
13
-
14
-
15
-
16
-
17
-
18
-
19
-
20
-
21
-
22
-
 23
23 -
 24
24 -
 25
25 -
 26
26 -
 27
27 -
 28
28 -
 29
29 -
 30
30 -
 31
31 -
 32
32 -
 33
33 -
 34
34 -
 35
35 -
 36
36 -
 37
37 -
 38
38 -
 39
39 -
 40
40 -
 41
41 -
 42
42 -
 43
43 -
44
-
45
-
46
-
47
-
48
-
49
-
50
-
51
-
52
-
53
-
54
-
55
-
56
-
57
-
58
-
59
-
60
-
61
-
62
-
63
-
64
-
65
-
66
-
67
-
68
-
69
-
70
-
71
-
72
-
73
-
74
-
75
-
76
-
77
-
78
-
79
-
80
-
81
-
82
-
83
-
84
-
85
-
86
-
87
-
88
-
89
-
90
-
91
-
92
-
93
-
94
-
95
-
96
-
97
-
98
-
99
-
100
-
101
-
102
-
103
-
104
-
105
-
106
-
107
-
108
-
109
-
110
-
111
-
112
-
113
-
114
-
115
-
116
-
117
-
118
-
119
-
120
-
121
-
122
-
123
-
124
-
125
-
126
-
127
-
128
-
129
-
130
-
131
-
132
-
133
-
134
-
135
-
136
-
137
-
138
-
139
 |
 |

II - 8
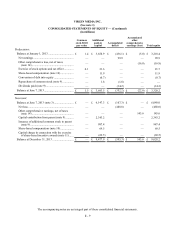
VIRGIN MEDIA INC.
(See note 1)
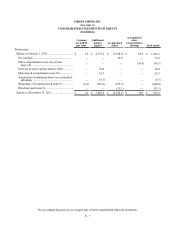
CONSOLIDATED STATEMENTS OF EQUITY — (Continued)
(in millions)
Common
stock $0.01
par value
Additional
paid-in
capital Accumulated
deficit
Accumulated
other
comprehensive
earnings (loss) Total equity
Predecessor:
Balance at January 1, 2012 ................................... £ 1.6 £ 3,866.6 £ (3,259.3) £ 30.0 £ 638.9
Net earnings........................................................ — — 2,913.4 — 2,913.4
Other comprehensive loss, net of taxes
(note 14).......................................................... — — — (35.8)(35.8)
Exercise of stock options and tax effect ............. — 8.4 — — 8.4
Share-based compensation (note 10).................. — 20.9 — — 20.9
Excess tax benefits on stock-based
compensation .................................................. — 32.5 — — 32.5
Acquisition of additional shares in a controlled
subsidiary ........................................................ —(0.9) — — (0.9)
Repurchase of common stock (note 9) ............... (0.2)(268.6)(62.9) — (331.7)
Dividends paid (note 9) ...................................... — — (27.3) — (27.3)
Balance at December 31, 2012 ............................. £ 1.4 £ 3,658.9 £ (436.1) £ (5.8) £ 3,218.4
The accompanying notes are an integral part of these consolidated financial statements.