Virgin Media 2013 Annual Report Download - page 133
Download and view the complete annual report
Please find page 133 of the 2013 Virgin Media annual report below. You can navigate through the pages in the report by either clicking on the pages listed below, or by using the keyword search tool below to find specific information within the annual report.-
 1
1 -
2
-
3
-
4
-
5
-
6
-
7
-
8
-
9
-
10
-
11
-
12
-
13
-
14
-
15
-
16
-
17
-
18
-
19
-
20
-
21
-
22
-
23
-
24
-
25
-
26
-
27
-
28
-
29
-
30
-
31
-
32
-
33
-
34
-
35
-
36
-
37
-
38
-
39
-
40
-
41
-
42
-
43
-
44
-
45
-
46
-
47
-
48
-
49
-
50
-
51
-
52
-
53
-
54
-
55
-
56
-
57
-
58
-
59
-
60
-
61
-
62
-
63
-
64
-
65
-
66
-
67
-
68
-
69
-
70
-
71
-
72
-
73
-
74
-
75
-
76
-
77
-
78
-
79
-
80
-
81
-
82
-
83
-
84
-
85
-
86
-
87
-
88
-
89
-
90
-
91
-
92
-
93
-
94
-
95
-
96
-
97
-
98
-
99
-
100
-
101
-
102
-
103
-
104
-
105
-
106
-
107
-
108
-
109
-
110
-
111
-
112
-
113
-
114
-
115
-
116
-
117
-
118
-
119
-
120
-
121
-
122
-
 123
123 -
 124
124 -
 125
125 -
 126
126 -
 127
127 -
 128
128 -
 129
129 -
 130
130 -
 131
131 -
 132
132 -
 133
133 -
 134
134 -
 135
135 -
 136
136 -
 137
137 -
 138
138 -
 139
139
 |
 |
III - 23
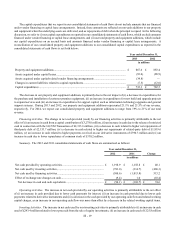
The nature and amount of labor and other costs to be capitalized with respect to construction and installation activities involves
significant judgment. In addition to direct external and internal labor and materials, we also capitalize other costs directly attributable
to our construction and installation activities, including dispatch costs, quality-control costs, vehicle-related costs and certain
warehouse-related costs. The capitalization of these costs is based on time sheets, time studies, standard costs, call tracking systems
and other verifiable means that directly link the costs incurred with the applicable capitalizable activity. We continuously monitor
the appropriateness of our capitalization policies and update the policies when necessary to respond to changes in facts and
circumstances, such as the development of new products and services, and changes in the manner that installations or construction
activities are performed.
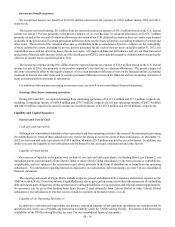
Useful Lives of Long-Lived Assets
We depreciate our property and equipment on a straight-line basis over the estimated useful life of the assets. The determination
of the useful lives of property and equipment requires significant management judgment, based on factors such as the estimated
physical lives of the assets, technological changes, changes in anticipated use, legal and economic factors, rebuild and equipment
swap-out plans, and other factors. Our intangible assets with finite lives consist of customer relationships. Customer relationship
intangible assets are amortized on a straight-line basis over the estimated weighted average life of the customer relationships. The
determination of the estimated useful life of customer relationship intangible assets requires significant management judgment
and is primarily based on historical and forecasted subscriber disconnect rates, adjusted when necessary for risk associated with
demand, competition, technological changes and other economic factors. We regularly review whether changes to estimated useful
lives are required in order to accurately reflect the economic use of our property and equipment and intangible assets with finite
lives. Any changes to estimated useful lives are reflected prospectively. Depreciation and amortization expense during the period
from June 8 to December 31, 2013, the period from January 1 to June 7, 2013 and the years ended December 31, 2012 and
December 31, 2011 was £910.2 million, £432.8 million, £966.4 million and £1,046.4 million, respectively. A 10% increase in the
aggregate amount of the depreciation and amortization expense during the combined 2013 Predecessor and Successor periods
would have resulted in a £134.3 million or 85.9% decrease in our 2013 operating income.
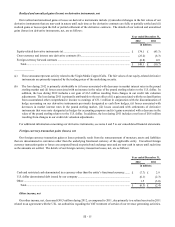
Fair Value Measurements
GAAP provides guidance with respect to the recurring and nonrecurring fair value measurements and for a fair value hierarchy
that prioritizes the inputs to valuation techniques used to measure fair value into three broad levels. Level 1 inputs are quoted
market prices in active markets for identical assets or liabilities that the reporting entity has the ability to access at the measurement
date. Level 2 inputs are inputs other than quoted market prices included within Level 1 that are observable for the asset or liability,
either directly or indirectly. Level 3 inputs are unobservable inputs for the asset or liability.
Recurring Valuations. We perform recurring fair value measurements with respect to our derivative instruments, each of which
are carried at fair value. We use (i) cash flow valuation models to determine the fair values of our interest rate and foreign currency
derivative instruments and (ii) a binomial option pricing model to determine the fair values of our equity-related derivative
instruments. For a detailed discussion of the inputs we use to determine the fair value of our derivative instruments, see note 5 to
our consolidated financial statements. See also note 4 to our consolidated financial statements for information concerning our
derivative instruments.
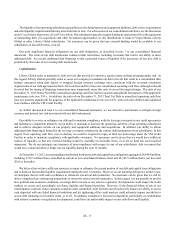
Changes in the fair values of our derivative instruments have had, and we believe will continue to have, a significant and
volatile impact on our results of operations. During the period from June 8 to December 31, 2013, the period from January 1 to
June 7, 2013 and the years ended December 31, 2012 and December 31, 2011, our continuing operations included net gains (losses)
of (£203.4 million), £51.8 million, £148.1 million and (£50.7 million), respectively, attributable to changes in the fair values of
these items.
As further described in note 4 to our consolidated financial statements, actual amounts received or paid upon the settlement
of our derivative instruments may differ materially from the recorded fair values at December 31, 2013.
For information concerning the sensitivity of the fair value of certain of our more significant derivative instruments to changes
in market conditions, see Quantitative and Qualitative Disclosures About Market Risk — Sensitivity Information below.