Virgin Media 2013 Annual Report Download - page 46
Download and view the complete annual report
Please find page 46 of the 2013 Virgin Media annual report below. You can navigate through the pages in the report by either clicking on the pages listed below, or by using the keyword search tool below to find specific information within the annual report.-
 1
1 -
2
-
3
-
4
-
5
-
6
-
7
-
8
-
9
-
10
-
11
-
12
-
13
-
14
-
15
-
16
-
17
-
18
-
19
-
20
-
21
-
22
-
23
-
24
-
25
-
26
-
27
-
28
-
29
-
30
-
31
-
32
-
33
-
34
-
35
-
 36
36 -
 37
37 -
 38
38 -
 39
39 -
 40
40 -
 41
41 -
 42
42 -
 43
43 -
 44
44 -
 45
45 -
 46
46 -
 47
47 -
 48
48 -
 49
49 -
 50
50 -
 51
51 -
 52
52 -
 53
53 -
 54
54 -
 55
55 -
 56
56 -
57
-
58
-
59
-
60
-
61
-
62
-
63
-
64
-
65
-
66
-
67
-
68
-
69
-
70
-
71
-
72
-
73
-
74
-
75
-
76
-
77
-
78
-
79
-
80
-
81
-
82
-
83
-
84
-
85
-
86
-
87
-
88
-
89
-
90
-
91
-
92
-
93
-
94
-
95
-
96
-
97
-
98
-
99
-
100
-
101
-
102
-
103
-
104
-
105
-
106
-
107
-
108
-
109
-
110
-
111
-
112
-
113
-
114
-
115
-
116
-
117
-
118
-
119
-
120
-
121
-
122
-
123
-
124
-
125
-
126
-
127
-
128
-
129
-
130
-
131
-
132
-
133
-
134
-
135
-
136
-
137
-
138
-
139
 |
 |

VIRGIN MEDIA INC.
(See note 1)
Notes to Consolidated Financial Statements — (Continued)
December 31, 2013, 2012 and 2011
II - 21
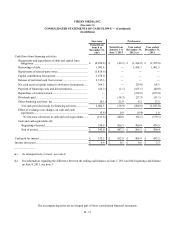
(c) Amount primarily includes intangible assets related to customer relationships. At June 7, 2013, the weighted average useful
life of our intangible assets was approximately seven years.
(d) Amount includes a £23.0 million liability that was recorded to adjust an unfavorable capacity contract to its estimated fair
value. This amount will be amortized through the March 31, 2014 expiration date of the contract as a reduction of Virgin
Media’s operating expenses so that the net effect of this amortization and the payments required under the contract
approximate market rates. During the period from June 8, 2013 through December 31, 2013, £14.4 million of this liability
was amortized as a reduction of operating expenses in our consolidated statement of operations.
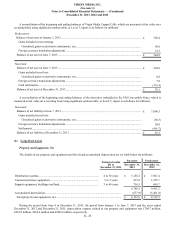
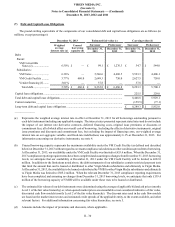
(e) Amount includes the equity component of the VM Convertible Notes (as defined and described in note 7) of £1,068.5
million (on the date of the LG/VM Transaction) that is reflected as a current derivative liability. Following the LG/VM
Transaction and through December 31, 2013, 94.4% of the VM Convertible Notes have been exchanged for Class A and
Class C ordinary shares of Liberty Global and cash pursuant to the terms of the VM Convertible Notes Indenture (as defined
in note 7). For additional information, see note 7.
(f) No amounts have been allocated to deferred revenue with respect to the ongoing performance obligations associated with
our B2B service contracts, as our view is that the remaining fees to be received under these contracts approximate fair value
given our estimates of the costs associated with these ongoing obligations.
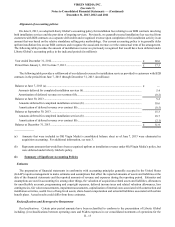
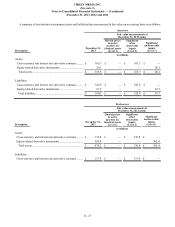
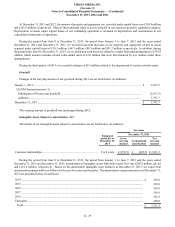
(4) Derivative Instruments
We have entered into various derivative instruments to manage (i) interest rate exposure, (ii) foreign currency exposure with
respect to the United States (U.S.) dollar ($) and (iii) equity exposure with respect to the dilutive effects of the VM Convertible
Notes. Although we applied hedge accounting to certain of our derivative instruments prior to the LG/VM Transaction, we currently
do not apply hedge accounting to our derivative instruments. Accordingly, during the Successor periods, changes in the fair values
of our derivative instruments are recorded in realized and unrealized gains or losses on derivative instruments, net, in our
consolidated statements of operations. Prior to the LG/VM Transaction, the effective portion of the net fair value adjustments
associated with these derivative instruments was reflected in other comprehensive earnings (loss).
The following table provides details of the fair values of our derivative instrument assets and liabilities (in millions):
Successor Predecessor
December 31, 2013 December 31, 2012
Current Long-term (a) Total Current Long-term (a) Total
Assets:
Cross-currency and interest rate
derivative contracts (b) (c)............. £ 27.7 £ 138.0 £ 165.7 £ 36.2 £ 140.6 £ 176.8
Equity-related derivative
instruments (d) ............................... — 20.1 20.1 — 302.4 302.4
Total.............................................. £ 27.7 £ 158.1 £ 185.8 £ 36.2 £ 443.0 £ 479.2
Liabilities:
Cross-currency and interest rate
derivative contracts (b) (c)............. £ 69.2 £ 253.7 £ 322.9 £ 29.3 £ 88.1 £ 117.4
Equity-related derivative
instruments (d) ............................... 67.3 — 67.3 — — —
Total.............................................. £ 136.5 £ 253.7 £ 390.2 £ 29.3 £ 88.1 £ 117.4
______________
(a) Our long-term derivative assets and liabilities are included in other assets, net, and other long-term liabilities, respectively,
in our consolidated balance sheets.
(b) We consider credit risk in our fair value assessments. As of December 31, 2013 and 2012, (i) the fair values of our cross-
currency and interest rate derivative contracts that represented assets have been reduced by credit risk valuation adjustments