Virgin Media 2013 Annual Report Download - page 83
Download and view the complete annual report
Please find page 83 of the 2013 Virgin Media annual report below. You can navigate through the pages in the report by either clicking on the pages listed below, or by using the keyword search tool below to find specific information within the annual report.-
 1
1 -
2
-
3
-
4
-
5
-
6
-
7
-
8
-
9
-
10
-
11
-
12
-
13
-
14
-
15
-
16
-
17
-
18
-
19
-
20
-
21
-
22
-
23
-
24
-
25
-
26
-
27
-
28
-
29
-
30
-
31
-
32
-
33
-
34
-
35
-
36
-
37
-
38
-
39
-
40
-
41
-
42
-
43
-
44
-
45
-
46
-
47
-
48
-
49
-
50
-
51
-
52
-
53
-
54
-
55
-
56
-
57
-
58
-
59
-
60
-
61
-
62
-
63
-
64
-
65
-
66
-
67
-
68
-
69
-
70
-
71
-
72
-
 73
73 -
 74
74 -
 75
75 -
 76
76 -
 77
77 -
 78
78 -
 79
79 -
 80
80 -
 81
81 -
 82
82 -
 83
83 -
 84
84 -
 85
85 -
 86
86 -
 87
87 -
 88
88 -
 89
89 -
 90
90 -
 91
91 -
 92
92 -
 93
93 -
94
-
95
-
96
-
97
-
98
-
99
-
100
-
101
-
102
-
103
-
104
-
105
-
106
-
107
-
108
-
109
-
110
-
111
-
112
-
113
-
114
-
115
-
116
-
117
-
118
-
119
-
120
-
121
-
122
-
123
-
124
-
125
-
126
-
127
-
128
-
129
-
130
-
131
-
132
-
133
-
134
-
135
-
136
-
137
-
138
-
139
 |
 |

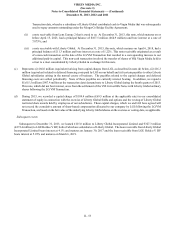
VIRGIN MEDIA INC.
(See note 1)
Notes to Consolidated Financial Statements — (Continued)
December 31, 2013, 2012 and 2011
II - 58
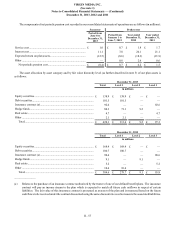
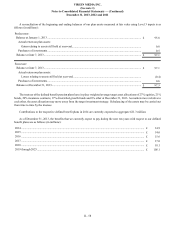
A reconciliation of the beginning and ending balances of our plan assets measured at fair value using Level 3 inputs is as
follows (in millions):
Predecessor:
Balance at January 1, 2013 ................................................................................................................................... £ 95.8
Actual return on plan assets:
Gains relating to assets still held at year-end................................................................................................. 0.8
Purchases of investments................................................................................................................................... 0.5
Balance at June 7, 2013........................................................................................................................................ £ 97.1
Successor:
Balance at June 7, 2013........................................................................................................................................ £ 97.1
Actual return on plan assets:
Losses relating to assets still held at year-end............................................................................................... (0.4)
Purchases of investments................................................................................................................................... 0.6
Balance at December 31, 2013............................................................................................................................. £ 97.3
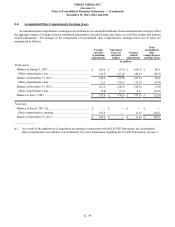
The trustees of the defined benefit pension plans have in place weighted average target asset allocations of 27% equities, 21%
bonds, 29% insurance contracts, 17% diversified growth funds and 6% other at December 31, 2013. As markets move relative to
each other, the asset allocation may move away from the target investment strategy. Rebalancing of the assets may be carried out
from time to time by the trustees.
Contributions to the respective defined benefit plans in 2014 are currently expected to aggregate £21.3 million.
As of December 31, 2013, the benefits that we currently expect to pay during the next ten years with respect to our defined
benefit plans are as follows (in millions):
2014 ............................................................................................................................................................................ £ 14.9
2015 ............................................................................................................................................................................ £ 14.6
2016 ............................................................................................................................................................................ £ 15.6
2017 ............................................................................................................................................................................ £ 17.0
2018 ............................................................................................................................................................................ £ 18.1
2019 through 2023...................................................................................................................................................... £ 105.1