SunTrust 2003 Annual Report Download - page 94
Download and view the complete annual report
Please find page 94 of the 2003 SunTrust annual report below. You can navigate through the pages in the report by either clicking on the pages listed below, or by using the keyword search tool below to find specific information within the annual report.-
 1
1 -
2
-
3
-
4
-
5
-
6
-
7
-
8
-
9
-
10
-
11
-
12
-
13
-
14
-
15
-
16
-
17
-
18
-
19
-
20
-
21
-
22
-
23
-
24
-
25
-
26
-
27
-
28
-
29
-
30
-
31
-
32
-
33
-
34
-
35
-
36
-
37
-
38
-
39
-
40
-
41
-
42
-
43
-
44
-
45
-
46
-
47
-
48
-
49
-
50
-
51
-
52
-
53
-
54
-
55
-
56
-
57
-
58
-
59
-
60
-
61
-
62
-
63
-
64
-
65
-
66
-
67
-
68
-
69
-
70
-
71
-
72
-
73
-
74
-
75
-
76
-
77
-
78
-
79
-
80
-
81
-
82
-
83
-
 84
84 -
 85
85 -
 86
86 -
 87
87 -
 88
88 -
 89
89 -
 90
90 -
 91
91 -
 92
92 -
 93
93 -
 94
94 -
 95
95 -
 96
96 -
 97
97 -
 98
98 -
 99
99 -
 100
100 -
 101
101 -
 102
102 -
 103
103 -
 104
104
 |
 |

92 SunTrust Banks, Inc. Annual Report 2003
NOTES TO CONSOLIDATED FINANCIAL STATEMENTS continued
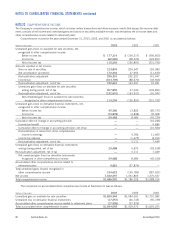
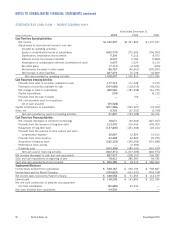
STATEMENTS OF CASH FLOW — PARENT COMPANY ONLY
Year Ended December 31
(Dollars in thousands) 2003 2002 2001
Cash Flow from Operating Activities:
Net income $1,332,297 $1,331,809 $1,375,537
Adjustments to reconcile net income to net cash
provided by operating activities:
Equity in undistributed income of subsidiaries (469,779) 272,905 (156,953)
Depreciation, amortization and accretion 5,304 6,016 8,703
Deferred income tax provision (benefit) 8,037 2,184 (7,800)
Amortization of compensation element of performance stock 5,475 3,074 6,110
Securities gains (7,117) (4,326) (224)
Net decrease (increase) in other assets 86,767 (94,951) (232,957)
Net increase in other liabilities 467,473 76,108 30,869
Net cash provided by operating activities 1,428,457 1,592,819 1,023,285
Cash Flows from Investing Activities:
Proceeds from sales of securities available for sale 177,712 117,638 5,370
Purchases of securities available for sale (345,066) (118,919) (46,411)
Net change in loans to subsidiaries 489,526 (181,948) 161,750
Capital expenditures (193) —(6,131)
Proceeds from the sale of assets —759 —
Net cash proceeds used for acquisitions,
net of cash acquired (55,528) ——
Capital contributions to subsidiaries (251,286) (543,227) (74,303)
Other, net 6,726 (67,351) (3,799)
Net cash provided by (used in) investing activities 21,891 (793,048) 36,476
Cash Flows from Financing Activities:
Net increase (decrease) in short-term borrowings 18,671 (93,604) (427,047)
Proceeds from the issuance of long-term debt 123,376 316,456 600,000
Repayment of long-term debt (137,805) (451,608) (22,161)
Proceeds from the exercise of stock options and stock
compensation expense 36,667 12,824 19,013
Proceeds from stock issuance 44,268 40,809 22,235
Acquisition of treasury stock (182,152) (340,656) (551,485)
Performance stock activity —(2,606) —
Dividends paid (505,396) (489,543) (463,529)
Net cash used in financing activities (602,371) (1,007,928) (822,974)
Net increase (decrease) in cash and cash equivalents 847,977 (208,157) 236,787
Cash and cash equivalents at beginning of year 78,412 286,569 49,782
Cash and cash equivalents at end of period $926,389 $78,412 $ 286,569
Supplemental Disclosure
Income taxes received from subsidiaries $528,187 $495,194 $ 558,887
Income taxes paid by Parent Company (339,629) (433,341) (444,758)
Net income taxes received by Parent Company $188,558 $61,853 $ 114,129
Interest paid $138,298 $163,805 $ 222,785
Net non-cash contribution of premises and equipment
(to) from subsidiaries (32,689) 24,234 —
Non-cash dividend from subsidiaries 54,554 ——