SunTrust 2003 Annual Report Download - page 93
Download and view the complete annual report
Please find page 93 of the 2003 SunTrust annual report below. You can navigate through the pages in the report by either clicking on the pages listed below, or by using the keyword search tool below to find specific information within the annual report.-
 1
1 -
2
-
3
-
4
-
5
-
6
-
7
-
8
-
9
-
10
-
11
-
12
-
13
-
14
-
15
-
16
-
17
-
18
-
19
-
20
-
21
-
22
-
23
-
24
-
25
-
26
-
27
-
28
-
29
-
30
-
31
-
32
-
33
-
34
-
35
-
36
-
37
-
38
-
39
-
40
-
41
-
42
-
43
-
44
-
45
-
46
-
47
-
48
-
49
-
50
-
51
-
52
-
53
-
54
-
55
-
56
-
57
-
58
-
59
-
60
-
61
-
62
-
63
-
64
-
65
-
66
-
67
-
68
-
69
-
70
-
71
-
72
-
73
-
74
-
75
-
76
-
77
-
78
-
79
-
80
-
81
-
82
-
 83
83 -
 84
84 -
 85
85 -
 86
86 -
 87
87 -
 88
88 -
 89
89 -
 90
90 -
 91
91 -
 92
92 -
 93
93 -
 94
94 -
 95
95 -
 96
96 -
 97
97 -
 98
98 -
 99
99 -
 100
100 -
 101
101 -
 102
102 -
 103
103 -
104
 |
 |

Annual Report 2003 SunTrust Banks, Inc. 91
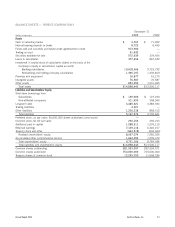
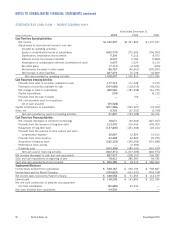
BALANCE SHEETS — PARENT COMPANY ONLY
December 31
(Dollars in thousands) 2003 2002
Assets
Cash in subsidiary banks $3,767 $71,922
Interest-bearing deposits in banks 8,722 6,490
Funds sold and securities purchased under agreements to resell 913,900 —
Trading account 91,432 —
Securities available for sale 572,639 334,455
Loans to subsidiaries 377,656 867,182
Investment in capital stock of subsidiaries stated on the basis of the
Company’s equity in subsidiaries’ capital accounts
Banking subsidiaries 10,618,566 9,723,792
Nonbanking and holding company subsidiaries 1,365,197 1,336,819
Premises and equipment 16,877 51,175
Intangible assets 76,587 76,587
Other assets 853,099 1,031,695
Total assets $14,898,442 $13,500,117
Liabilities and Shareholders’ Equity
Short-term borrowings from
Subsidiaries $139,006 $119,230
Non-affiliated companies 311,490 358,945
Long-term debt 3,485,621 3,383,934
Trading liabilities 4,921 —
Other liabilities 1,226,238 868,512
Total liabilities 5,167,276 4,730,621
Preferred stock, no par value; 50,000,000 shares authorized; none issued ——
Common stock, $1.00 par value 294,163 294,163
Additional paid in capital 1,288,311 1,276,110
Retained earnings 7,149,118 6,322,217
Treasury stock and other (664,518) (632,464)
Realized shareholders’ equity 8,067,074 7,260,026
Accumulated other comprehensive income 1,664,092 1,509,470
Total shareholders’ equity 9,731,166 8,769,496
Total liabilities and shareholders’ equity $14,898,442 $13,500,117
Common shares outstanding 281,923,057 282,504,571
Common shares authorized 750,000,000 750,000,000
Treasury shares of common stock 12,239,700 11,658,186