SunTrust 2003 Annual Report Download - page 28
Download and view the complete annual report
Please find page 28 of the 2003 SunTrust annual report below. You can navigate through the pages in the report by either clicking on the pages listed below, or by using the keyword search tool below to find specific information within the annual report.-
 1
1 -
2
-
3
-
4
-
5
-
6
-
7
-
8
-
9
-
10
-
11
-
12
-
13
-
14
-
15
-
16
-
17
-
 18
18 -
 19
19 -
 20
20 -
 21
21 -
 22
22 -
 23
23 -
 24
24 -
 25
25 -
 26
26 -
 27
27 -
 28
28 -
 29
29 -
 30
30 -
 31
31 -
 32
32 -
 33
33 -
 34
34 -
 35
35 -
 36
36 -
 37
37 -
 38
38 -
39
-
40
-
41
-
42
-
43
-
44
-
45
-
46
-
47
-
48
-
49
-
50
-
51
-
52
-
53
-
54
-
55
-
56
-
57
-
58
-
59
-
60
-
61
-
62
-
63
-
64
-
65
-
66
-
67
-
68
-
69
-
70
-
71
-
72
-
73
-
74
-
75
-
76
-
77
-
78
-
79
-
80
-
81
-
82
-
83
-
84
-
85
-
86
-
87
-
88
-
89
-
90
-
91
-
92
-
93
-
94
-
95
-
96
-
97
-
98
-
99
-
100
-
101
-
102
-
103
-
104
 |
 |

26 SunTrust Banks, Inc. Annual Report 2003
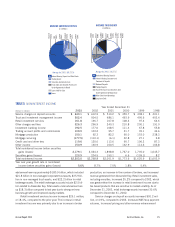
MANAGEMENT’S DISCUSSION continued
initiatives contributed to the increase in this line item. Combined
mortgage production and servicing income decreased $9.6 mil-
lion, or 54.0%, compared to 2002. Record mortgage production
for 2003 was more than offset by the decline in mortgage servic-
ing income. Mortgage production for 2003 was $43.7 billion
compared to $30.8 billion for 2002. The decline in mortgage
servicing income was due to accelerated amortization of mort-
gage servicing rights resulting from increased prepayments in
the low interest rate environment. Although the combined mort-
gage noninterest income components declined, revenue for the
Mortgage line of business increased benefiting from higher inter-
est income from mortgage loans held for sale and mortgage
loans retained in the Company’s portfolio.
Other charges and fees were up $29.5 million, or 9.9%, as
a result of increased letter of credit fees and insurance revenues.
The increase in letter of credit fees was due to increased volumes.
The increase in insurance revenues was due to increased sales
volume and the acquisition of an insurance subsidiary of
Lighthouse. Combined trading account profits and commissions
and investment banking income, SunTrust’s capital market rev-
enue sources, increased $22.2 million, or 7.9%, compared to
the prior year. The increase was primarily due to strong growth
in debt capital markets businesses. Other noninterest income
increased $20.0 million compared to 2002 primarily due to the
consolidation of certain affordable housing partnerships in 2003.
The Company incurred net securities gains during 2003 of
$123.9 million compared to $204.5 million in 2002 as the
Company continued to manage the securities portfolio to take
advantage of market yield opportunities.
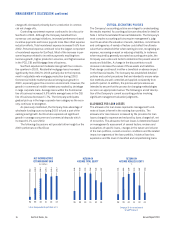
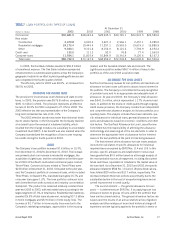
NONINTEREST EXPENSE
Noninterest expense increased $181.2 million, or 5.6%,
in 2003. Compared to 2002, total personnel expense increased
$126.0 million, or 6.9%, primarily due to increases in pension
and incentive costs. Pension expense increased $47.7 million, or
315.2%, due to a reduced expected long-term rate of return on
plan assets and a lower discount rate for measuring pension lia-
bilities. The Company expects to reduce its expected long-term
rate of return in 2004 by an additional 25 basis points to 8.5%.
The increase in incentives was primarily due to an increase in
commission and performance based incentive plans. This
increase was primarily attributed to the Mortgage line of busi-
ness due to the record production volumes during 2003.
Additionally, incentive cost increases were recorded in the
CIB (primarily due to the performance of debt capital markets)
and PCS (primarily due to stronger financial markets and new
business volumes) lines of business.
Marketing and customer development expense increased
$20.3 million, or 25.4%, due to the Company’s expanded 2003
marketing strategy and sales focus. Campaigns and promotions
for 2003 included the “Giant Truckload Sale” (primarily deposit
accounts) the “Mini Cooper Campaign” (home equity lines) and
the “With the Works Campaign” (deposit and home equity lines).
Noninterest expense increased $13.5 million due to the
acquisition of Lighthouse. Additionally, the consolidation of
certain affordable housing partnerships in 2003 increased non-
interest expense $28.7 million most of which was recorded in
other expense.
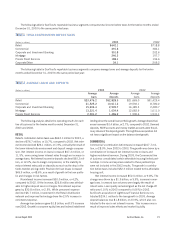
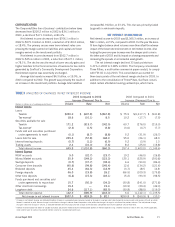
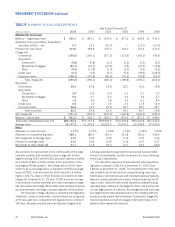
TABLE 6
NONINTEREST EXPENSE
Year Ended December 31
(Dollars in millions) 2003 2002 2001 2000 1999 1998
Employee compensation $1,585.9 $1,512.1 $1,484.5 $1,469.0 $1,522.6 $1,433.7
Employee benefits 358.6 306.4 193.0 175.0 175.8 181.8
Total personnel expense 1,944.5 1,818.5 1,677.5 1,644.0 1,698.4 1,615.5
Net occupancy expense 237.3 229.3 210.4 202.6 197.4 192.2
Outside processing and software 246.7 225.2 199.1 172.3 150.3 138.4
Equipment expense 178.4 174.8 189.8 193.7 198.5 178.8
Marketing and customer development 100.3 80.0 104.0 106.2 105.4 107.1
Credit and collection services 70.3 64.6 74.6 56.9 68.7 70.4
Postage and delivery 69.0 69.4 64.0 63.3 68.1 64.4
Amortization of intangible assets 64.5 58.9 46.3 35.5 32.8 43.1
Communications 61.3 64.8 59.2 59.8 66.3 62.1
Other staff expense 60.4 52.0 58.5 51.5 50.1 47.8
Consulting and legal 57.4 91.1 87.7 59.6 62.5 67.5
Operating supplies 39.8 46.8 48.3 47.3 51.9 54.0
FDIC premiums 18.0 17.4 16.0 13.5 18.1 18.3
Merger-related expense —16.0 — 42.4 45.6 119.4
Other real estate income (2.0) (0.1) (4.2) (3.8) (4.8) (9.8)
Other expense 254.7 210.7 168.7 83.7 96.0 100.9
Total noninterest expense $3,400.6 $3,219.4 $2,999.9 $2,828.5 $2,905.3 $2,870.1
Year over year growth rate 5.6% 7.3% 6.1% (2.6%) 1.2%
Efficiency ratio 59.99% 57.99% 56.12% 57.47% 60.35% 62.02%