SunTrust 2003 Annual Report Download - page 36
Download and view the complete annual report
Please find page 36 of the 2003 SunTrust annual report below. You can navigate through the pages in the report by either clicking on the pages listed below, or by using the keyword search tool below to find specific information within the annual report.-
 1
1 -
2
-
3
-
4
-
5
-
6
-
7
-
8
-
9
-
10
-
11
-
12
-
13
-
14
-
15
-
16
-
17
-
18
-
19
-
20
-
21
-
22
-
23
-
24
-
25
-
 26
26 -
 27
27 -
 28
28 -
 29
29 -
 30
30 -
 31
31 -
 32
32 -
 33
33 -
 34
34 -
 35
35 -
 36
36 -
 37
37 -
 38
38 -
 39
39 -
 40
40 -
 41
41 -
 42
42 -
 43
43 -
 44
44 -
 45
45 -
 46
46 -
47
-
48
-
49
-
50
-
51
-
52
-
53
-
54
-
55
-
56
-
57
-
58
-
59
-
60
-
61
-
62
-
63
-
64
-
65
-
66
-
67
-
68
-
69
-
70
-
71
-
72
-
73
-
74
-
75
-
76
-
77
-
78
-
79
-
80
-
81
-
82
-
83
-
84
-
85
-
86
-
87
-
88
-
89
-
90
-
91
-
92
-
93
-
94
-
95
-
96
-
97
-
98
-
99
-
100
-
101
-
102
-
103
-
104
 |
 |

34 SunTrust Banks, Inc. Annual Report 2003
MANAGEMENT’S DISCUSSION continued
$2,558.8 million, or 16.8%, and money market accounts
increased $1,747.6 million, or 8.5%, compared to 2002. The
continued uncertainty of the financial markets contributed to the
success of these initiatives.
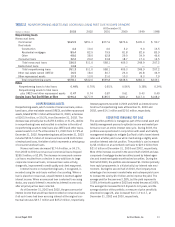
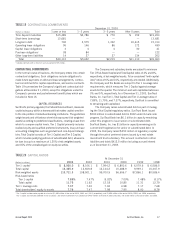
LIQUIDITY MANAGEMENT
Liquidity risk is the risk of being unable to timely meet obligations as
they come due at a reasonable funding cost. SunTrust manages this
risk by maintaining borrowing resources to fund increases in assets
and replace maturing obligations or deposit withdrawals, both in the
normal course of business and in times of unusual events. In addi-
tion, the Company enters into off-balance sheet arrangements and
commitments which could impact the Company’s liquidity posi-
tion. These activities are discussed in the Off-Balance Sheet
Arrangements section on pages 35 through 37. The Asset Liability
Management Committee (ALCO) of the Company sets the policies
and reviews adherence to these policies.
The Company’s sources of funds include a large, stable
deposit base, secured advances from the Federal Home Loan
Bank and access to the capital markets. The Company struc-
tures its balance sheet so that illiquid assets, such as loans,
are funded through customer deposits, long-term debt, other
liabilities and capital.
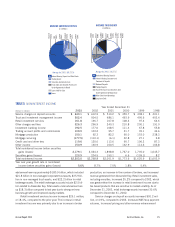
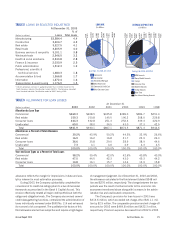
Customer-based core deposits, the Company’s largest and
most cost-effective source of funding, accounted for 65% of the
funding base on average for 2003, as compared to 69% in 2002.
The decrease over 2002 is largely attributable to funding growth in
loans held for sale and the investment portfolio, which have been
largely financed through wholesale funding sources. The yearly
average of customer deposits increased by 6.1%, or $4.0 billion,
from 2002 to 2003 reflecting a full year of the Huntington-Florida
branch acquisition, successful marketing campaigns and growth
from customer uncertainty due to volatility of the financial markets.
Increases in rates, improved economic activity and confidence in
the financial markets may lead to disintermediation of deposits,
which may need to be replaced with higher cost borrowings in
the future.
Net short-term unsecured borrowed funds, including whole-
sale domestic and international deposits and fed funds, totaled
$15.9 billion at year-end 2003, as compared to $14.7 billion
at year-end 2002. Net short-term unsecured borrowed funds
included $3.2 billion of commercial paper at December 31, 2003,
related to Three Pillars, which was not consolidated at year-end
2002. Total net wholesale funding, including short-term unsecured
borrowings, secured wholesale borrowings and long-term debt,
totaled $35.9 billion at year-end 2003, compared to $32.0 billion
at year-end 2002. Long-term debt increased from $11.9 billion at
December 31, 2002 to $15.3 billion at December 31, 2003.
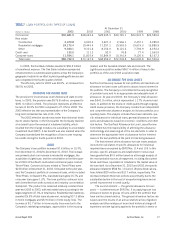
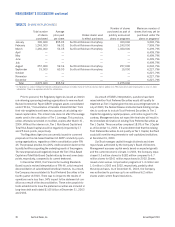
TABLE 16
LOAN MATURITY
At December 31, 2003
Remaining Maturities of Selected Loans
Within 1–5 After
(Dollars in millions) Total 1 Year Years 5 Years
Loan Maturity
Commercial1$26,553.8 $13,447.9 $ 9,105.8 $4,000.1
Real estate – construction 4,479.8 2,137.6 1,121.2 1,221.0
Total $31,033.6 $15,585.5 $10,227.0 $5,221.1
Interest Rate Sensitivity
Selected loans with:
Predetermined interest rates $1,701.7 $2,039.7
Floating or adjustable interest rates 8,525.3 3,181.4
Total $10,227.0 $5,221.1
1Excludes $4,128.1 million in lease financing.
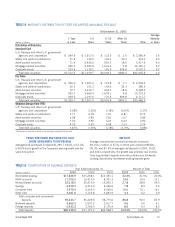
TABLE 17
MATURITY OF CONSUMER TIME AND OTHER TIME DEPOSITS IN AMOUNTS OF $100,000 OR MORE
At December 31, 2003
(Dollars in millions) Consumer Brokered Foreign Other Total
Months to Maturity
3 or less $1,267.2 $ 515.8 $5,080.8 $1.6 $ 6,865.4
Over 3 through 6 601.8 1,096.9 — — 1,698.7
Over 6 through 12 622.3 953.9 — — 1,576.2
Over 12 995.8 617.5 — — 1,613.3
Total $3,487.1 $3,184.1 $5,080.8 $1.6 $11,753.6