SunTrust 2003 Annual Report Download - page 61
Download and view the complete annual report
Please find page 61 of the 2003 SunTrust annual report below. You can navigate through the pages in the report by either clicking on the pages listed below, or by using the keyword search tool below to find specific information within the annual report.-
 1
1 -
2
-
3
-
4
-
5
-
6
-
7
-
8
-
9
-
10
-
11
-
12
-
13
-
14
-
15
-
16
-
17
-
18
-
19
-
20
-
21
-
22
-
23
-
24
-
25
-
26
-
27
-
28
-
29
-
30
-
31
-
32
-
33
-
34
-
35
-
36
-
37
-
38
-
39
-
40
-
41
-
42
-
43
-
44
-
45
-
46
-
47
-
48
-
49
-
50
-
 51
51 -
 52
52 -
 53
53 -
 54
54 -
 55
55 -
 56
56 -
 57
57 -
 58
58 -
 59
59 -
 60
60 -
 61
61 -
 62
62 -
 63
63 -
 64
64 -
 65
65 -
 66
66 -
 67
67 -
 68
68 -
 69
69 -
 70
70 -
 71
71 -
72
-
73
-
74
-
75
-
76
-
77
-
78
-
79
-
80
-
81
-
82
-
83
-
84
-
85
-
86
-
87
-
88
-
89
-
90
-
91
-
92
-
93
-
94
-
95
-
96
-
97
-
98
-
99
-
100
-
101
-
102
-
103
-
104
 |
 |

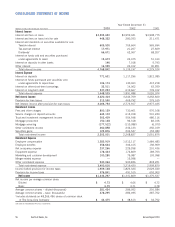
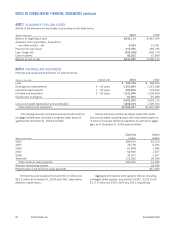
Annual Report 2003 SunTrust Banks, Inc. 59
Year Ended December 31
(Dollars in thousands) 2003 2002 2001
Cash Flows from Operating Activities
Net income $1,332,297 $1,331,809 $ 1,375,537
Adjustments to reconcile net income to net cash
provided by operating activities:
Net gain on extinguishment of debt ——(9,720)
Depreciation, amortization and accretion 881,542 619,965 357,371
Origination of mortgage servicing rights (384,198) (277,343) (159,278)
Provisions for loan losses and foreclosed property 314,667 470,730 275,541
Deferred income tax provision 179,905 146,326 42,035
Amortization of compensation element of performance stock 5,475 3,074 6,110
Securities gains (123,876) (204,547) (153,080)
Net gain on sale of assets (12,596) (16,030) (8,467)
Originated loans held for sale, net (43,816,219) (28,954,686) (21,455,760)
Sales of loans held for sale 46,011,952 25,526,486 18,895,447
Net increase in other assets (526,923) (852,597) (679,140)
Net increase in other liabilities 271,207 643,203 359,155
Net cash provided by (used in) operating activities 4,133,233 (1,563,610) (1,154,249)
Cash Flows from Investing Activities
Proceeds from maturities of securities available for sale 10,841,607 5,217,479 3,114,827
Proceeds from sales of securities available for sale 7,633,468 5,626,929 5,419,095
Purchases of securities available for sale (19,933,984) (14,687,010) (7,754,258)
Net (increase) decrease in loans (5,533,737) (2,744,616) 332,021
Proceeds from sale of loans 392,412 721,195 762,405
Capital expenditures (157,608) (123,245) (89,224)
Proceeds from the sale of other assets 39,324 29,599 35,889
Net cash proceeds received from consolidation of affordable
housing partnerships 13,932 ——
Net cash proceeds (used for) received from acquisitions,
net of cash acquired (34,261) 1,160,333 —
Net cash (used in) provided by investing activities (6,738,847) (4,799,336) 1,820,755
Cash Flows from Financing Activities
Net increase in consumer and commercial deposits 2,404,052 3,481,945 5,644,915
Net (decrease) increase in foreign and brokered deposits (1,328,925) 4,224,638 (7,641,830)
Net decrease in funds purchased and other short-term borrowings (1,124,378) (131,681) (902,003)
Proceeds from the issuance of long-term debt 3,281,676 1,451,692 7,114,068
Repayment of long-term debt (257,119) (2,236,225) (3,389,198)
Proceeds from the exercise of stock options and stock
compensation expense 36,667 12,824 19,013
Proceeds from stock issuance 44,268 40,809 22,235
Acquisition of treasury stock (182,152) (340,656) (551,485)
Performance stock activity —(2,606) —
Dividends paid (505,396) (489,543) (463,529)
Net cash provided by (used in) financing activities 2,368,693 6,011,197 (147,814)
Net (decrease) increase in cash and cash equivalents (236,921) (351,749) 518,692
Cash and cash equivalents at beginning of year 5,558,295 5,910,044 5,391,352
Cash and cash equivalents at end of period $5,321,374 $5,558,295 $ 5,910,044
Supplemental Disclosure
Interest paid $1,465,030 $1,926,320 $ 3,118,383
Income taxes paid, net 358,391 440,518 446,814
Non-cash impact to total assets as a result of
consolidation of Three Pillars 2,857,316 ——
Non-cash impact of securitizing loans ——1,903,518
Non-cash impact of STAR Systems Inc. sale ——52,919
See notes to Consolidated Financial Statements.
CONSOLIDATED STATEMENTS OF CASH FLOW