SunTrust 2003 Annual Report Download - page 35
Download and view the complete annual report
Please find page 35 of the 2003 SunTrust annual report below. You can navigate through the pages in the report by either clicking on the pages listed below, or by using the keyword search tool below to find specific information within the annual report.-
 1
1 -
2
-
3
-
4
-
5
-
6
-
7
-
8
-
9
-
10
-
11
-
12
-
13
-
14
-
15
-
16
-
17
-
18
-
19
-
20
-
21
-
22
-
23
-
24
-
 25
25 -
 26
26 -
 27
27 -
 28
28 -
 29
29 -
 30
30 -
 31
31 -
 32
32 -
 33
33 -
 34
34 -
 35
35 -
 36
36 -
 37
37 -
 38
38 -
 39
39 -
 40
40 -
 41
41 -
 42
42 -
 43
43 -
 44
44 -
 45
45 -
46
-
47
-
48
-
49
-
50
-
51
-
52
-
53
-
54
-
55
-
56
-
57
-
58
-
59
-
60
-
61
-
62
-
63
-
64
-
65
-
66
-
67
-
68
-
69
-
70
-
71
-
72
-
73
-
74
-
75
-
76
-
77
-
78
-
79
-
80
-
81
-
82
-
83
-
84
-
85
-
86
-
87
-
88
-
89
-
90
-
91
-
92
-
93
-
94
-
95
-
96
-
97
-
98
-
99
-
100
-
101
-
102
-
103
-
104
 |
 |

Annual Report 2003 SunTrust Banks, Inc. 33
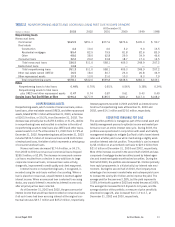
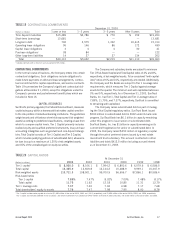
FUNDS PURCHASED AND SECURITIES SOLD
UNDER AGREEMENTS TO REPURCHASE
Average funds purchased increased $1,290.7 million, or 12.4%,
in 2003 due to growth in the Company’s earning assets over the
same time period.
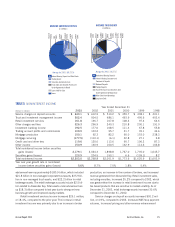
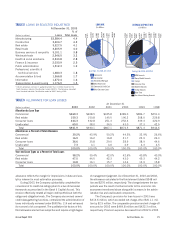
DEPOSITS
Average consumer and commercial deposits increased
$4,014.1 million, or 6.1%, in 2003 and comprised 86.8%,
92.0%, and 87.9% of average total deposits in 2003, 2002,
and 2001, respectively. The growth was primarily due to initia-
tives to grow retail deposits and reduce reliance on wholesale
funding. Specifically, noninterest-bearing deposits grew
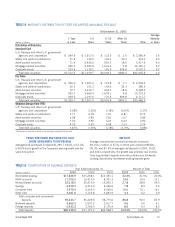
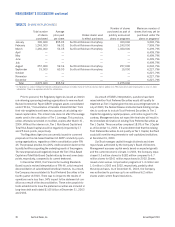
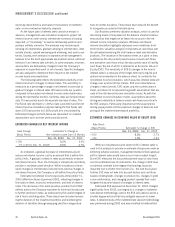
TABLE 14
MATURITY DISTRIBUTION OF DEBT SECURITIES AVAILABLE FOR SALE
At December 31, 2003
Average
1 Year 1–5 5–10 After 10 Maturity
(Dollars in millions) or Less Years Years Years Total in Years
Distribution of Maturities:
Amortized Cost
U.S. Treasury and other U.S. government
agencies and corporations $ 244.4 $ 1,917.0 $ 123.5 $ 1.5 $ 2,286.4 3.6
States and political subdivisions 51.8 144.5 136.4 30.3 363.0 4.5
Asset-backed securities171.4 4,426.2 901.7 18.6 5,417.9 4.0
Mortgage-backed securities1920.0 9,583.9 1,676.4 0.8 12,181.1 3.2
Corporate bonds 224.8 1,178.1 165.5 528.8 2,097.2 9.2
Total debt securities $1,512.4 $17,249.7 $3,003.5 $580.0 $22,345.6 4.0
Fair Value
U.S. Treasury and other U.S. government
agencies and corporations $ 246.0 $ 1,921.0 $ 123.8 $ 1.7 $ 2,292.5
States and political subdivisions 52.3 151.3 144.6 32.3 380.5
Asset-backed securities172.7 4,432.7 904.0 18.6 5,428.0
Mortgage-backed securities1929.7 9,664.9 1,678.1 0.8 12,273.5
Corporate bonds 229.0 1,197.6 175.3 509.8 2,111.7
Total debt securities $1,529.7 $17,367.5 $3,025.8 $563.2 $22,486.2
Weighted-Average Yield (FTE):
U.S. Treasury and other U.S. government
agencies and corporations 4.08% 3.22% 4.18% 8.00% 3.37%
States and political subdivisions 5.77 6.78 7.01 6.81 6.75
Asset-backed securities16.08 2.85 2.81 1.07 2.89
Mortgage-backed securities13.30 3.90 4.24 6.20 3.90
Corporate bonds 4.79 3.93 5.58 2.53 3.79
Total debt securities 3.87% 3.59% 4.18% 2.79% 3.66%
1Distribution of maturities is based on the estimated average life of the asset.
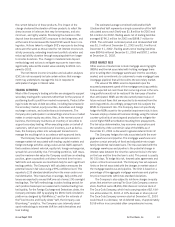
TABLE 15
COMPOSITION OF AVERAGE DEPOSITS
Year Ended December 31 Percent of Total
(Dollars in millions) 2003 2002 2001 2003 2002 2001
Noninterest-bearing $17,826.9 $15,268.1 $13,491.1 22.3% 21.5% 20.9%
NOW accounts 11,702.0 10,315.4 8,471.3 14.6 14.5 13.1
Money Market accounts 22,218.5 20,470.9 15,830.1 27.8 28.8 24.5
Savings 6,259.3 6,310.0 6,066.6 7.8 8.9 9.4
Consumer time 7,975.4 9,342.4 9,092.6 10.0 13.1 14.1
Other time 3,461.6 3,722.8 3,823.9 4.3 5.2 5.9
Total consumer and commercial
deposits 69,443.7 65,429.6 56,775.6 86.8 92.0 87.9
Brokered deposits 3,662.0 2,537.2 2,617.7 4.6 3.6 4.1
Foreign deposits 6,933.3 3,190.4 5,175.4 8.6 4.4 8.0
Total deposits $80,039.0 $71,157.2 $64,568.7 100.0% 100.0% 100.0%