SunTrust 2003 Annual Report Download - page 25
Download and view the complete annual report
Please find page 25 of the 2003 SunTrust annual report below. You can navigate through the pages in the report by either clicking on the pages listed below, or by using the keyword search tool below to find specific information within the annual report.-
 1
1 -
2
-
3
-
4
-
5
-
6
-
7
-
8
-
9
-
10
-
11
-
12
-
13
-
14
-
 15
15 -
 16
16 -
 17
17 -
 18
18 -
 19
19 -
 20
20 -
 21
21 -
 22
22 -
 23
23 -
 24
24 -
 25
25 -
 26
26 -
 27
27 -
 28
28 -
 29
29 -
 30
30 -
 31
31 -
 32
32 -
 33
33 -
 34
34 -
 35
35 -
36
-
37
-
38
-
39
-
40
-
41
-
42
-
43
-
44
-
45
-
46
-
47
-
48
-
49
-
50
-
51
-
52
-
53
-
54
-
55
-
56
-
57
-
58
-
59
-
60
-
61
-
62
-
63
-
64
-
65
-
66
-
67
-
68
-
69
-
70
-
71
-
72
-
73
-
74
-
75
-
76
-
77
-
78
-
79
-
80
-
81
-
82
-
83
-
84
-
85
-
86
-
87
-
88
-
89
-
90
-
91
-
92
-
93
-
94
-
95
-
96
-
97
-
98
-
99
-
100
-
101
-
102
-
103
-
104
 |
 |

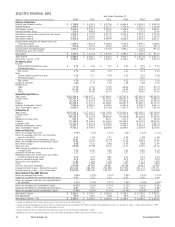
Annual Report 2003 SunTrust Banks, Inc. 23
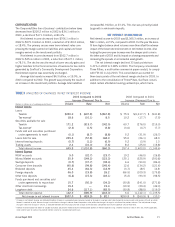
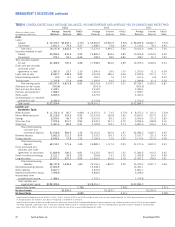
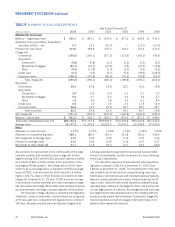
2000 1999 1998
Average Income/ Yields/ Average Income/ Yields/ Average Income/ Yields/
Balances Expense Rates Balances Expense Rates Balances Expense Rates
$68,968.8 $5,552.4 8.05% $61,648.3 $4,691.2 7.61% $56,537.1 $4,499.6 7.96%
1,075.5 83.0 7.72 1,101.1 80.1 7.27 1,053.4 81.9 7.78
70,044.3 5,635.4 8.05 62,749.4 4,771.3 7.60 57,590.5 4,581.5 7.96
14,593.7 981.4 6.73 14,728.7 927.6 6.30 12,618.9 819.7 6.50
469.7 35.4 7.54 558.2 44.6 7.99 633.8 52.2 8.23
15,063.4 1,016.8 6.75 15,286.9 972.2 6.36 13,252.7 871.9 6.58
1,439.8 92.8 6.44 1,338.0 73.4 5.48 1,306.2 71.6 5.48
1,451.1 110.6 7.62 2,577.1 172.2 6.68 2,414.7 180.4 7.47
39.9 0.9 2.17 53.0 2.7 5.02 99.8 5.8 5.78
570.5 28.8 5.06 251.3 10.9 4.36 217.0 9.1 4.21
88,609.0 6,885.3 7.77 82,255.7 6,002.7 7.30 74,880.9 5,720.3 7.64
(869.0) (942.1) (940.5)
3,316.4 3,630.3 3,306.9
1,625.4 1,596.3 1,486.6
3,362.2 3,332.5 3,219.1
2,353.8 2,948.1 3,583.9
$98,397.8 $92,820.8 $85,536.9
$8,035.4 $ 107.4 1.34% $ 7,736.3 $ 70.9 0.92% $ 7,149.5 $ 101.6 1.42%
12,093.6 526.9 4.36 12,189.7 456.1 3.74 11,104.1 422.9 3.81
6,434.2 228.5 3.55 6,918.8 203.8 2.95 6,645.9 216.9 3.26
9,935.5 528.5 5.32 9,824.3 468.6 4.77 10,390.4 534.4 5.14
4,085.3 236.0 5.78 4,275.0 214.3 5.01 4,423.9 244.4 5.53
40,584.0 1,627.3 4.01 40,944.1 1,413.7 3.45 39,713.8 1,520.2 3.86
3,308.7 215.9 6.52 7.0 0.4 5.27 394.0 21.6 5.47
9,621.7 609.7 6.34 4,087.8 212.0 5.19 1,906.2 102.4 5.37
53,514.4 2,452.9 4.58 45,038.9 1,626.1 3.61 42,014.0 1,644.2 3.91
10,754.4 651.2 6.06 15,220.8 749.6 4.92 12,164.9 634.1 5.21
1,550.6 97.9 6.31 1,689.9 79.5 4.71 2,391.8 127.8 5.34
8,034.6 534.9 6.66 5,858.6 359.5 6.14 5,368.0 340.7 6.35
73,854.0 3,736.9 5.06 67,808.2 2,814.7 4.15 61,938.7 2,746.8 4.43
13,177.5 12,803.2 11,711.3
3,864.4 4,018.7 4,033.3
6,031.6 6,368.3 5,641.4
1,470.3 1,822.4 2,212.2
$98,397.8 $92,820.8 $85,536.9
2.71% 3.15% 3.21%
$3,148.4 $3,188.0 $2,973.5
3.55% 3.88% 3.97%
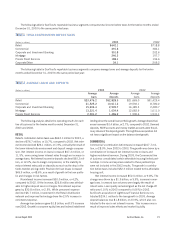
3Derivative instruments used to help balance the Company’s interest-sensitivity position increased net interest income $64.0 million in 2003, decreased
net interest income $50.4 million in 2002, $37.4 million in 2001, and $0.5 million in 2000, and increased net interest income $16.3 million and
$0.7 million in 1999 and 1998, respectively.