SunTrust 2003 Annual Report Download - page 44
Download and view the complete annual report
Please find page 44 of the 2003 SunTrust annual report below. You can navigate through the pages in the report by either clicking on the pages listed below, or by using the keyword search tool below to find specific information within the annual report.-
 1
1 -
2
-
3
-
4
-
5
-
6
-
7
-
8
-
9
-
10
-
11
-
12
-
13
-
14
-
15
-
16
-
17
-
18
-
19
-
20
-
21
-
22
-
23
-
24
-
25
-
26
-
27
-
28
-
29
-
30
-
31
-
32
-
33
-
 34
34 -
 35
35 -
 36
36 -
 37
37 -
 38
38 -
 39
39 -
 40
40 -
 41
41 -
 42
42 -
 43
43 -
 44
44 -
 45
45 -
 46
46 -
 47
47 -
 48
48 -
 49
49 -
 50
50 -
 51
51 -
 52
52 -
 53
53 -
 54
54 -
55
-
56
-
57
-
58
-
59
-
60
-
61
-
62
-
63
-
64
-
65
-
66
-
67
-
68
-
69
-
70
-
71
-
72
-
73
-
74
-
75
-
76
-
77
-
78
-
79
-
80
-
81
-
82
-
83
-
84
-
85
-
86
-
87
-
88
-
89
-
90
-
91
-
92
-
93
-
94
-
95
-
96
-
97
-
98
-
99
-
100
-
101
-
102
-
103
-
104
 |
 |

42 SunTrust Banks, Inc. Annual Report 2003
MANAGEMENT’S DISCUSSION continued
repricing characteristics and balance fluctuations of indetermi-
nate, or non-contractual maturity, deposits.
As the future path of interest rates cannot be known in
advance, management uses simulation analysis to project net
interest income under various interest rate scenarios including
expected, or “most likely,” as well as deliberately extreme and
perhaps unlikely scenarios. The analyses may include rapid
ramping of interest rates, gradual ramping of interest rates, inter-
est rate shocks, spread narrowing and widening, and yield curve
twists. Usually, each analysis incorporates what management
believes to be the most appropriate assumptions about customer
behavior in an interest rate scenario. In some analyses, however,
assumptions are deliberately changed to test the Company’s
exposure to a specified event or set of events. Specific strategies
are also analyzed to determine their impact on net interest
income levels and sensitivities.
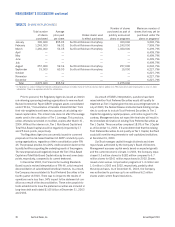
The following table reflects the estimated sensitivity of net
interest income to changes in interest rates. The sensitivity is
measured as a percentage change in net interest income due to
gradual changes in interest rates (25 basis points per quarter)
compared to forecasted net interest income under stable rates
during the next twelve months. Currently, rates are ramped down
only 75 basis points due to the absolute low level of rates. The
Fed Funds rate declined to 1.00% in late June 2003 and for net
interest income simulation purposes taking the Fed Funds rate
down 100 basis points to 0.00% would be a low probability.
Estimated changes set forth below are dependent on material
assumptions such as those previously discussed.
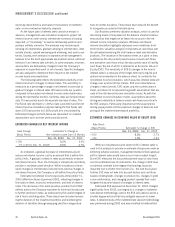
ESTIMATED CHANGES IN NET INTEREST INCOME
Rate Change Estimated % Change in
(Basis Points) Net Interest Income Over 12 Months
Dec. 31, 2003 Dec. 31, 2002
+100 0.2% 0.6%
-75 (-100 for Dec. 31, 2002) -0.6% -0.9%
As indicated, a gradual decrease in interest rates would
reduce net interest income, but by an amount that is within the
policy limits. A gradual increase in rates would tend to enhance
net interest income. Thus, the Company’s interest rate sensitivity
position is modestly asset-sensitive. While simulations of more
rapid changes in interest rates indicate more adverse changes in
net interest income, the Company is still within the policy limits.
Estimated net interest income exposures at December 31,
2003 differ from those at year-end 2002, reflecting changes in
the balance sheet, economic environment, and level of interest
rates. The decrease in the asset sensitive position from 2002
reflects actions the Company has taken to minimize its exposure
to further declines in rates, as evidenced by the smaller degree of
risk it has to declining rates. These steps have included increas-
ing the duration of the investment portfolio and shortening the
duration of liabilities through swapping debt from longer dura-
tions to shorter durations. These steps have reduced the benefit
to rising rates as noted in the table above.
SunTrust also performs valuation analysis, which is used for
discerning levels of risk present in the balance sheet and deriva-
tive positions that might not be taken into account in the net
interest income simulation analysis. Whereas net interest
income simulation highlights exposures over a relatively short
time horizon, valuation analysis incorporates all cash flows over
the estimated remaining life of all balance sheet and derivative
positions. The valuation of the balance sheet, at a point in time,
is defined as the discounted present value of asset cash flows
and derivative cash flows minus the discounted value of liability
cash flows, the net of which is referred to as Economic Value of
Equity (EVE). The sensitivity of EVE to changes in the level of
interest rates is a measure of the longer-term repricing risk and
options risk embedded in the balance sheet. In contrast to the
net interest income simulation, which assumes interest rates will
change over a period of time (ramp), EVE uses instantaneous
changes in rates (shock). EVE values only the current balance
sheet, and does not incorporate the growth assumptions that are
used in the net interest income simulation model. As with the
net interest income simulation model, assumptions about the
timing and variability of balance sheet cash flows are critical in
the EVE analysis. Particularly important are the assumptions
driving prepayments and the expected changes in balances and
pricing of the indeterminate deposit portfolios.
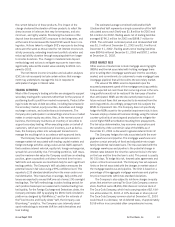
ESTIMATED CHANGES IN ECONOMIC VALUE OF EQUITY (EVE)
Rate Shock
(Basis Points) Estimated % Change in EVE
Dec. 31, 2003 Dec. 31, 2002
+100 -3.3% 2.7%
-100 1.5% -7.2%
While an instantaneous and severe shift in interest rates is
used in this analysis to provide an estimate of exposure under an
extremely adverse scenario, management believes that a gradual
shift in interest rates would have a much more modest impact.
Since EVE measures the discounted present value of cash flows
over the estimated lives of instruments, the change in EVE does
not directly correlate to the degree that earnings would be
impacted over a shorter time horizon (i.e., the next fiscal year).
Further, EVE does not take into account factors such as future
balance sheet growth, changes in product mix, changes in yield
curve relationships, and changing product spreads that could
mitigate the adverse impact of changes in interest rates.
Estimated EVE exposures at December 31, 2003 changed
significantly from 2002, due largely to a change in indetermi-
nate deposit methodology used in the EVE calculations and to a
smaller degree actions that help mitigate exposure to lower
rates. A detailed study of the indeterminate deposit methodology
was performed during 2003 and was modified to better reflect