SunTrust 2003 Annual Report Download - page 52
Download and view the complete annual report
Please find page 52 of the 2003 SunTrust annual report below. You can navigate through the pages in the report by either clicking on the pages listed below, or by using the keyword search tool below to find specific information within the annual report.-
 1
1 -
2
-
3
-
4
-
5
-
6
-
7
-
8
-
9
-
10
-
11
-
12
-
13
-
14
-
15
-
16
-
17
-
18
-
19
-
20
-
21
-
22
-
23
-
24
-
25
-
26
-
27
-
28
-
29
-
30
-
31
-
32
-
33
-
34
-
35
-
36
-
37
-
38
-
39
-
40
-
41
-
 42
42 -
 43
43 -
 44
44 -
 45
45 -
 46
46 -
 47
47 -
 48
48 -
 49
49 -
 50
50 -
 51
51 -
 52
52 -
 53
53 -
 54
54 -
 55
55 -
 56
56 -
 57
57 -
 58
58 -
 59
59 -
 60
60 -
 61
61 -
 62
62 -
63
-
64
-
65
-
66
-
67
-
68
-
69
-
70
-
71
-
72
-
73
-
74
-
75
-
76
-
77
-
78
-
79
-
80
-
81
-
82
-
83
-
84
-
85
-
86
-
87
-
88
-
89
-
90
-
91
-
92
-
93
-
94
-
95
-
96
-
97
-
98
-
99
-
100
-
101
-
102
-
103
-
104
 |
 |

50 SunTrust Banks, Inc. Annual Report 2003
MANAGEMENT’S DISCUSSION continued
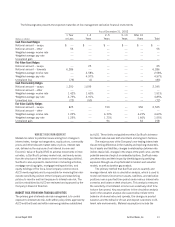
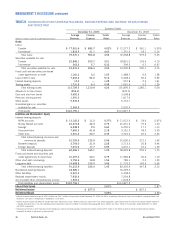
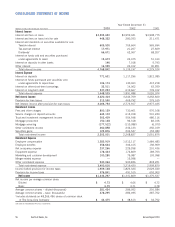
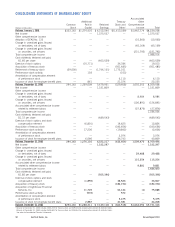
Private Client Services
2003 2002
(Dollars in millions) 432143 21
Average total assets $ 2,362.2 $ 2,296.7 $ 2,137.7 $ 1,930.5 $ 1,873.1 $ 1,731.0 $ 1,727.8 $ 1,720.2
Average total liabilities 1,563.9 1,568.7 1,535.2 1,451.3 1,587.2 1,532.1 1,583.4 1,543.9
Average total equity — — — — — — — —
Net interest income (FTE) 12.4 11.8 9.8 9.7 10.0 9.9 10.2 10.1
Provision for loan losses 0.5 0.6 0.5 0.4 0.6 0.5 0.6 0.6
Net interest income after
provision for loan losses 11.9 11.2 9.3 9.3 9.4 9.4 9.6 9.5
Noninterest income 172.5 165.4 165.1 157.1 149.4 155.9 167.1 157.1
Noninterest expense 131.0 134.9 125.7 122.3 117.7 115.7 119.2 120.2
Total contribution before taxes 53.4 41.7 48.7 44.1 41.1 49.6 57.5 46.4
Provision for income taxes — — — — — — — —
Net income $ 53.4 $ 41.7 $ 48.7 $ 44.1 $ 41.1 $ 49.6 $ 57.5 $ 46.4
Corporate/Other
2003 2002
(Dollars in millions) 432143 21
Average total assets $27,929.9 $25,374.3 $25,614.9 $25,798.4 $23,958.5 $21,575.3 $21,306.9 $20,456.8
Average total liabilities 37,832.6 37,488.2 36,293.8 36,445.5 33,114.9 28,771.6 28,447.2 29,988.9
Average total equity 9,435.8 9,236.8 8,864.1 8,786.6 8,823.3 8,943.3 8,743.2 8,385.9
Net interest income (FTE) 146.0 99.4 150.0 180.6 181.5 192.0 167.2 165.4
Provision for loan losses 5.2 (1.7) (0.4) (0.1) 4.8 21.2 (6.0) 72.7
Net interest income after
provision for loan losses 140.8 101.1 150.4 180.7 176.7 170.8 173.2 92.7
Noninterest income (7.9) 11.7 14.0 17.9 4.2 39.1 45.5 73.8
Noninterest expense 158.4 122.6 149.0 144.4 188.5 150.3 125.5 106.6
Total contribution before taxes (25.5) (9.8) 15.4 54.2 (7.6) 59.6 93.2 59.9
Provision for income taxes 164.0 147.6 156.5 153.8 91.9 146.2 176.1 116.8
Net loss $ (189.5) $ (157.4) $ (141.1) $ (99.6) $ (99.5) $ (86.6) $ (82.9) $ (56.9)
investment management income, and service charges on deposits.
Retail investment services income increased $10.7 million, or
32.4%, quarter over quarter, primarily due to an increase in broker
production, the number of brokers, and increased revenue gener-
ated from Alexander Key. Trust and investment management
income increased $10.2 million, or 8.5%, from the fourth quarter
of 2002 to the fourth quarter of 2003. The increase in trust and
investment income was attributed to strong sales momentum and
improved customer retention. Service charges on deposit accounts
increased $9.1 million, or 5.8%, from the fourth quarter of 2002
to the fourth quarter of 2003 primarily due to increased NSF/stop
payment volumes. Additionally, other noninterest income increased
$29.1 million, or 225.3%, in the fourth quarter of 2003 compared
to the same period of the prior year primarily due to the consolida-
tion of certain of the Company’s affordable housing partnerships.
Noninterest expense in the fourth quarter of 2003 was
$884.8 million, an increase of $48.4 million, or 5.8%, from the
fourth quarter of 2002. Personnel expense grew $60.0 million, or
13.1%, from the fourth quarter of 2002 to the fourth quarter of
2003. The increase in personnel expense was mainly attributable
to incentive and commissions payments related to higher business
volumes and an $11.5 million increase in performance incentives
as the Company met certain financial targets which were not
achieved in 2002. Pension expense increased $11.4 million due
to a reduced expected rate of return on plan assets and a lower
discount rate for measuring pension liabilities. The consolidation
of certain affordable housing partnerships resulted in an additional
$14.6 million of noninterest expense in the fourth quarter of 2003
compared to last year.
Provision for income taxes was $152.0 million for the fourth
quarter of 2003 compared to $81.6 million in the same period of
2002. The provision represents an effective tax rate of 30.7% for
the fourth quarter of 2003, compared to 19.4% for the fourth
quarter of 2002. The fourth quarter 2003 effective tax rate was
representative of the Company’s long-term normalized tax rate of
30-31%. The lower fourth quarter 2002 effective tax was prima-
rily due to tax benefits resulting from the Company standardizing
the recognition of low income housing tax credits and dividends
declared by a real estate investment trust subsidiary.