SunTrust 2003 Annual Report Download - page 23
Download and view the complete annual report
Please find page 23 of the 2003 SunTrust annual report below. You can navigate through the pages in the report by either clicking on the pages listed below, or by using the keyword search tool below to find specific information within the annual report.-
 1
1 -
2
-
3
-
4
-
5
-
6
-
7
-
8
-
9
-
10
-
11
-
12
-
 13
13 -
 14
14 -
 15
15 -
 16
16 -
 17
17 -
 18
18 -
 19
19 -
 20
20 -
 21
21 -
 22
22 -
 23
23 -
 24
24 -
 25
25 -
 26
26 -
 27
27 -
 28
28 -
 29
29 -
 30
30 -
 31
31 -
 32
32 -
 33
33 -
34
-
35
-
36
-
37
-
38
-
39
-
40
-
41
-
42
-
43
-
44
-
45
-
46
-
47
-
48
-
49
-
50
-
51
-
52
-
53
-
54
-
55
-
56
-
57
-
58
-
59
-
60
-
61
-
62
-
63
-
64
-
65
-
66
-
67
-
68
-
69
-
70
-
71
-
72
-
73
-
74
-
75
-
76
-
77
-
78
-
79
-
80
-
81
-
82
-
83
-
84
-
85
-
86
-
87
-
88
-
89
-
90
-
91
-
92
-
93
-
94
-
95
-
96
-
97
-
98
-
99
-
100
-
101
-
102
-
103
-
104
 |
 |

Annual Report 2003 SunTrust Banks, Inc. 21
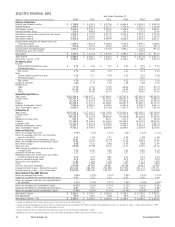
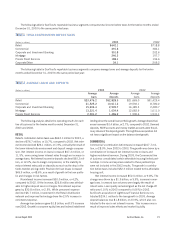
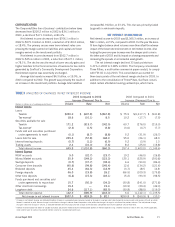
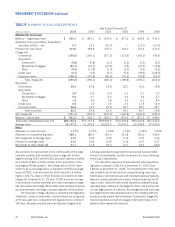
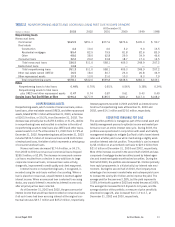
TABLE 3
ANALYSIS OF CHANGES IN NET INTEREST INCOME1
2003 Compared to 2002 2002 Compared to 2001
Increase (Decrease) Due to Increase (Decrease) Due to
(Dollars in millions on a taxable-equivalent basis) Volume Rate Net Volume Rate Net
Interest Income
Loans
Taxable $240.0 $ (607.8) $(367.8) $ 75.9 $(1,017.7) $ (941.8)
Tax-exempt218.6 (10.1) 8.5 10.2 (17.7) (7.5)
Securities available for sale
Taxable 171.2 (313.7) (142.5) 60.7 (276.0) (215.3)
Tax-exempt2(2.3) (1.5) (3.8) (3.0) (4.7) (7.7)
Funds sold and securities purchased
under agreements to resell (0.1) (8.7) (8.8) 5.2 (31.9) (26.7)
Loans held for sale 225.8 (57.8) 168.0 95.0 (26.1) 68.9
Interest-bearing deposits (5.7) (1.2) (6.9) 5.2 (3.9) 1.3
Trading assets 2.4 (10.0) (7.6) 8.2 (25.0) (16.8)
Total interest income 649.9 (1,010.8) (360.9) 257.4 (1,403.0) (1,145.6)
Interest Expense
NOW accounts 9.0 (32.7) (23.7) 19.2 (46.0) (26.8)
Money Market accounts 25.9 (149.2) (123.3) 125.1 (325.9) (200.8)
Savings deposits (0.7) (37.7) (38.4) 6.6 (93.0) (86.4)
Consumer time deposits (45.6) (99.8) (145.4) 12.6 (134.2) (121.6)
Brokered deposits 45.4 (64.3) (18.9) (3.7) 18.5 14.8
Foreign deposits 46.0 (19.8) 26.2 (66.5) (109.3) (175.8)
Other time deposits (6.8) (15.3) (22.1) (5.2) (93.3) (98.5)
Funds purchased and securities sold
under agreements to repurchase 15.7 (50.0) (34.3) (30.8) (241.0) (271.8)
Other short-term borrowings 19.4 — 19.4 (19.9) (29.4) (49.3)
Long-term debt 34.6 (117.1) (82.5) (30.8) (88.5) (119.3)
Total interest expense 142.9 (585.9) (443.0) 6.6 (1,142.1) (1,135.5)
Net change in net interest income $507.0 $ (424.9) $ 82.1 $250.8 $ (260.9) $ (10.1)
1Changes in net interest income are attributed to either changes in average balances (volume change) or changes in average rates (rate change) for earning assets and sources of funds on which
interest is received or paid. Volume change is calculated as change in volume times the previous rate, while rate change is change in rate times the previous volume. The rate/volume change,
change in rate times change in volume, is allocated between volume change and rate change at the ratio each component bears to the absolute value of their total.
2Interest income includes the effects of taxable-equivalent adjustments (reduced by the nondeductible portion of interest expense) using a federal income tax rate of 35% and, where applicable,
state income taxes to increase tax-exempt interest income to a taxable-equivalent basis.
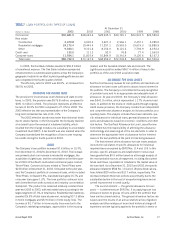
CORPORATE/OTHER
The Corporate/Other line of business’ contribution before taxes
decreased from $205.2 million in 2002 to $34.1 million in
2003, a decline of $171.0 million, or 83.4%.
Net interest income decreased from $706.1 million in
2002 to $575.9 million in 2003, a reduction of $130.2 million,
or 18.4%. The primary causes were lower interest rates com-
pressing the margin earned on liabilities and capital and lower
margins earned on the investment portfolio.
Noninterest income decreased from $162.7 million in
2002 to $35.6 million in 2003, a reduction of $127.1 million,
or 78.1%. The decline was the result of lower security gains and
higher transfers to the Commercial line of business for tax credits
generated by SunTrust’s Community Development Corporation.
Noninterest expense was essentially unchanged.
Average total assets increased $4.3 billion, or 19.9%, in
2003 compared to 2002. The growth was primarily the result of
an increase in the investment portfolio. Average total liabilities
increased $6.9 billion, or 23.0%. This rise was primarily fueled
by growth in wholesale deposits.
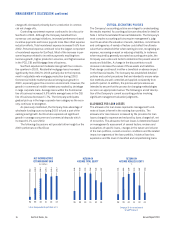
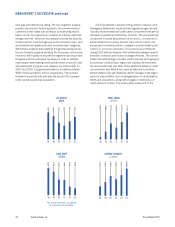
NET INTEREST INCOME/MARGIN
Net interest income for 2003 was $3,365.3 million, an increase of
$82.1 million, or 2.5%, compared to 2002. For the year the bene-
fit from higher balance sheet volumes more than offset the adverse
impact of the lower rate environment on net interest income. Also
helping the year over year increase was the steeper yield curve in
the latter part of 2003 and its impact on slowing prepayments and
increasing the spreads on incremental asset growth.
The net interest margin declined 33 basis points from
3.41% in 2002 to 3.08% in 2003. The Company consolidated
Three Pillars, a multi-seller commercial paper conduit, to comply
with FIN 46 in July 2003. This consolidation accounted for
three basis points of the net interest margin decline for 2003. In
addition to the consolidation of Three Pillars, SunTrust consoli-
dated certain affordable housing partnerships, which had a