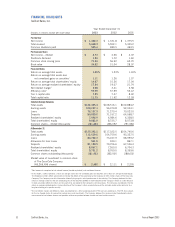
SunTrust 2003 Annual Report Download - page 22
Download and view the complete annual report
Please find page 22 of the 2003 SunTrust annual report below. You can navigate through the pages in the report by either clicking on the pages listed below, or by using the keyword search tool below to find specific information within the annual report.-
 1
1 -
2
-
3
-
4
-
5
-
6
-
7
-
8
-
9
-
10
-
11
-
 12
12 -
 13
13 -
 14
14 -
 15
15 -
 16
16 -
 17
17 -
 18
18 -
 19
19 -
 20
20 -
 21
21 -
 22
22 -
 23
23 -
 24
24 -
 25
25 -
 26
26 -
 27
27 -
 28
28 -
 29
29 -
 30
30 -
 31
31 -
 32
32 -
33
-
34
-
35
-
36
-
37
-
38
-
39
-
40
-
41
-
42
-
43
-
44
-
45
-
46
-
47
-
48
-
49
-
50
-
51
-
52
-
53
-
54
-
55
-
56
-
57
-
58
-
59
-
60
-
61
-
62
-
63
-
64
-
65
-
66
-
67
-
68
-
69
-
70
-
71
-
72
-
73
-
74
-
75
-
76
-
77
-
78
-
79
-
80
-
81
-
82
-
83
-
84
-
85
-
86
-
87
-
88
-
89
-
90
-
91
-
92
-
93
-
94
-
95
-
96
-
97
-
98
-
99
-
100
-
101
-
102
-
103
-
104
 |
 |

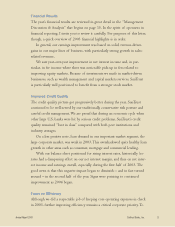
20 SunTrust Banks, Inc. Annual Report 2003
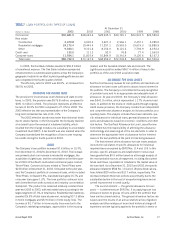
MANAGEMENT’S DISCUSSION continued
Total noninterest income grew $78.5 million, or 34.4%.
Noninterest income for 2003 included $61.6 million related to
the affordable housing unit of which $25.3 million was associated
with limited partnership income resulting from the consolidation of
certain affordable housing partnerships. An additional $38.8 mil-
lion was attributable to higher tax-effected revenue generated
by SunTrust’s Community Development Corporation, which was
transferred from the Corporate/Other line of business. The
remaining noninterest income growth resulted from increased
deposit service charges, credit card income and loan fees.
Total noninterest expense grew $19.6 million, or 5.8%. The
increase in noninterest expense included $7.3 million related to
the affordable housing unit, with the remainder of the expense
growth related to increased volumes.
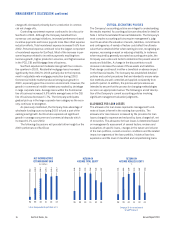
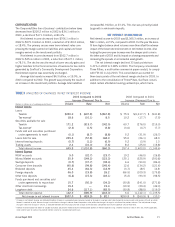
CORPORATE AND INVESTMENT BANKING
Corporate and Investment Banking’s contribution before taxes
increased $149.2 million, or 73.6%, for 2003 as compared
with 2002. The biggest factor in the improvement was a
$119.8 million decrease in the provision for loan losses. The
remaining $29.4 million increase was primarily due to improve-
ments of $20.9 million, or 4.0%, in noninterest income and
$11.4 million, or 4.2%, in net interest income offset by an
increase in noninterest expense of $2.8 million, or 0.8%.
To comply with FIN 46, Three Pillars Funding LLC (Three
Pillars), a multi-seller commercial paper conduit with $3.2 billion
in assets at December 31, 2003, was consolidated in the third
quarter of 2003. Including the effect of this consolidation, which
added $1.1 billion in average loan balances in 2003, average
loans declined $279.0 million, or 1.7%. Despite the decline in
outstanding loan balances, total commitments during 2003
were essentially unchanged from the prior year, but total binding
commitment usage declined to an approximate average of
30.1% in 2003 from 33.9% in 2002. The increase in noninter-
est income was driven largely by a substantial increase in debt
capital markets products.
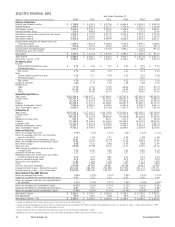
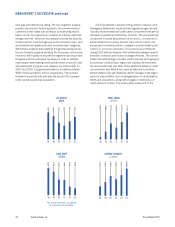
MORTGAGE
Driven by higher mortgage loan production resulting from record
low interest rates, Mortgage’s 2003 contribution before taxes of
$246.3 million was up $88.6 million, or 56.2%, compared to
2002. Mortgage loan production of $43.7 billion in 2003 repre-
sented another record year and was up 41.9% over the prior
record year.
Net interest income was up $171.3 million, or 45.7%, over
2002. Record production pushed average mortgage loans held
for sale balances up $3.6 billion, or 83.0%. The higher balances
were the primary reason for the net interest income increase.
Additionally, residential portfolio loans were up $1.2 billion, or
10.4%, and combined with wider spreads, contributed to the
increase in net interest income. Credit quality has remained high
even with the significant increase in the residential loan portfo-
lio. Net charge-offs were $2.5 million in 2003 compared to
$2.0 million in 2002. Due to high loan payoff levels, average
deposit volume grew $623.4 million, or 61.7%, compared to
2002. However, due to the low rate environment in both years,
the effect on net interest income was minimal.
Total noninterest income increased $1.3 million, or 9.3%,
in 2003 compared with 2002. Higher production-related
income resulting from record production and other noninterest
income was substantially offset by higher mortgage servicing
rights amortization expense. The higher mortgage servicing
rights expense resulted from record loan payoffs and amortiza-
tion of existing serviced loans. At December 31, 2003, loans
serviced totaled $69.0 billion compared with $57.1 billion at
December 31, 2002, a 20.8% increase.
As production volume and related income grew in 2003,
noninterest expense also increased. Noninterest expense was up
$83.5 million, or 37.3%, principally due to volume-related
expenses such as commission-based compensation, overtime,
temporary employees and other lending-related expenses that
vary with loan production.
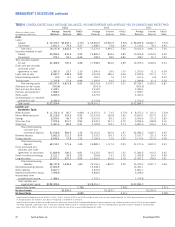
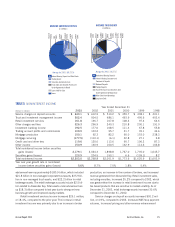
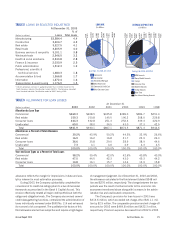
PRIVATE CLIENT SERVICES
Private Client Services’ contribution before taxes decreased
$6.5 million, or 3.3%, for the year ended December 31, 2003
compared to 2002.
Total noninterest income increased $30.6 million, or 4.9%,
for the year ended December 31, 2003 compared to 2002.
Average assets under management increased 4.1% compared
to 2002. Trust and investment management income decreased
$1.9 million, or 0.4%, for the year ended December 31, 2003
compared to 2002. As of December 31, 2003 and 2002, assets
under management were approximately $101.0 billion and
$89.6 billion, respectively. Assets under management increased
12.8% due to appreciation in the equity markets and net new
business. Lost business moderately improved compared to prior
periods, while new business maintained its momentum. Assets
under management include individually managed assets, the STI
Classic Funds, institutional assets managed by Trusco Capital
Management, and participant-directed retirement accounts.
SunTrust’s total assets under advisement were approximately
$180.9 billion, which included $21.8 billion in non-managed
corporate trust assets, $35.9 billion in non-managed trust assets,
and $22.2 billion in retail brokerage assets. The retail brokerage
accounts include $2.5 billion related to Alexander Key. As of
December 31, 2003, brokerage assets increased 30.6%
compared to December 31, 2002.
Retail investment income increased $24.0 million, or
18.0%, for the year ended December 31, 2003 compared to
2002. The increase in retail investment income was primarily
due to an increase in broker production, an increase in the
number of brokers, and increased revenue generated from
Alexander Key.
Noninterest expense increased $41.0 million, or 8.7%, for
the year ended December 31, 2003 compared to 2002. The
expense increases were primarily due to additional personnel
and occupancy expense associated with PCS’ business-related
initiatives. PCS continues to invest in the core business, new
product capabilities, and new distribution channels.