SunTrust 2003 Annual Report Download - page 89
Download and view the complete annual report
Please find page 89 of the 2003 SunTrust annual report below. You can navigate through the pages in the report by either clicking on the pages listed below, or by using the keyword search tool below to find specific information within the annual report.-
 1
1 -
2
-
3
-
4
-
5
-
6
-
7
-
8
-
9
-
10
-
11
-
12
-
13
-
14
-
15
-
16
-
17
-
18
-
19
-
20
-
21
-
22
-
23
-
24
-
25
-
26
-
27
-
28
-
29
-
30
-
31
-
32
-
33
-
34
-
35
-
36
-
37
-
38
-
39
-
40
-
41
-
42
-
43
-
44
-
45
-
46
-
47
-
48
-
49
-
50
-
51
-
52
-
53
-
54
-
55
-
56
-
57
-
58
-
59
-
60
-
61
-
62
-
63
-
64
-
65
-
66
-
67
-
68
-
69
-
70
-
71
-
72
-
73
-
74
-
75
-
76
-
77
-
78
-
 79
79 -
 80
80 -
 81
81 -
 82
82 -
 83
83 -
 84
84 -
 85
85 -
 86
86 -
 87
87 -
 88
88 -
 89
89 -
 90
90 -
 91
91 -
 92
92 -
 93
93 -
 94
94 -
 95
95 -
 96
96 -
 97
97 -
 98
98 -
 99
99 -
100
-
101
-
102
-
103
-
104
 |
 |

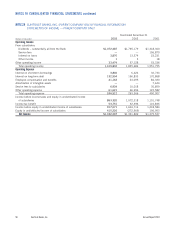
Annual Report 2003 SunTrust Banks, Inc. 87
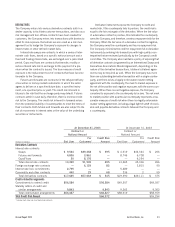
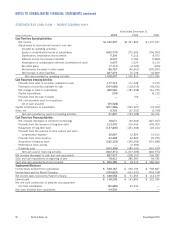
December 31, 2002
Corporate & Private
Investment Client Corporate/
(Dollars in thousands) Retail Commercial Banking Mortgage Services Other Consolidated
Average total assets $23,292,791 $21,264,843 $21,686,410 $18,675,398 $1,763,362 $21,833,292 $108,516,096
Average total liabilities 51,636,479 8,880,044 6,361,273 1,265,271 1,561,706 30,085,616 99,790,389
Average total equity —————8,725,707 8,725,707
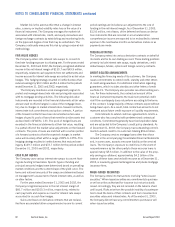
Net interest
income (FTE)11,360,333 533,544 268,536 374,547 40,148 706,123 3,283,231
Provision for
loan losses2102,656 38,592 227,097 6,379 2,345 92,723 469,792
Net interest income
after provision for
loan losses 1,257,677 494,952 41,439 368,168 37,803 613,400 2,813,439
Noninterest income 708,325 228,184 526,720 13,445 629,499 162,654 2,268,827
Noninterest expense 1,247,210 339,035 365,592 223,960 472,720 570,903 3,219,420
Total contribution
before taxes 718,792 384,101 202,567 157,653 194,582 205,151 1,862,846
Provision for
income taxes3—————531,037 531,037
Net income $718,792 $ 384,101 $ 202,567 $ 157,653 $ 194,582 $ (325,886) $ 1,331,809
December 31, 2001
Corporate & Private
Investment Client Corporate/
(Dollars in thousands) Retail Commercial Banking Mortgage Services Other Consolidated
Average total assets $19,838,803 $19,645,631 $23,141,626 $18,800,620 $1,449,470 $20,008,058 $102,884,208
Average total liabilities 45,657,041 7,696,694 5,440,839 1,024,977 1,365,275 33,625,622 94,810,448
Average total equity —————8,073,760 8,073,760
Net interest
income (FTE)11,443,247 531,422 357,036 242,457 44,054 675,148 3,293,364
Provision for
loan losses249,623 31,989 144,789 6,919 1,517 40,328 275,165
Net interest income
after provision for
loan losses 1,393,624 499,433 212,247 235,538 42,537 634,820 3,018,199
Noninterest income 597,267 197,308 413,624 100,189 577,682 165,805 2,051,875
Noninterest expense 1,165,023 348,132 406,261 217,683 408,783 453,988 2,999,870
Total contribution
before taxes 825,868 348,609 219,610 118,044 211,436 346,637 2,070,204
Provision for
income taxes3—————694,667 694,667
Net income $825,868 $ 348,609 $ 219,610 $ 118,044 $ 211,436 $ (348,030) $ 1,375,537
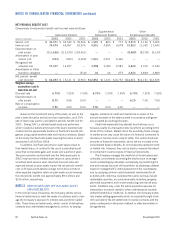
1Net interest income is fully taxable equivalent and is presented on a matched maturity funds transfer price basis for the lines of business.
2Provision for loan losses includes a credit risk premium charge for the lines of business.
3Includes regular income tax provision and taxable-equivalent income adjustment reversal of $39,522 and $40,764 for the twelve months ended December 31, 2002 and 2001, respectively.