SunTrust 2003 Annual Report Download - page 32
Download and view the complete annual report
Please find page 32 of the 2003 SunTrust annual report below. You can navigate through the pages in the report by either clicking on the pages listed below, or by using the keyword search tool below to find specific information within the annual report.-
 1
1 -
2
-
3
-
4
-
5
-
6
-
7
-
8
-
9
-
10
-
11
-
12
-
13
-
14
-
15
-
16
-
17
-
18
-
19
-
20
-
21
-
 22
22 -
 23
23 -
 24
24 -
 25
25 -
 26
26 -
 27
27 -
 28
28 -
 29
29 -
 30
30 -
 31
31 -
 32
32 -
 33
33 -
 34
34 -
 35
35 -
 36
36 -
 37
37 -
 38
38 -
 39
39 -
 40
40 -
 41
41 -
 42
42 -
43
-
44
-
45
-
46
-
47
-
48
-
49
-
50
-
51
-
52
-
53
-
54
-
55
-
56
-
57
-
58
-
59
-
60
-
61
-
62
-
63
-
64
-
65
-
66
-
67
-
68
-
69
-
70
-
71
-
72
-
73
-
74
-
75
-
76
-
77
-
78
-
79
-
80
-
81
-
82
-
83
-
84
-
85
-
86
-
87
-
88
-
89
-
90
-
91
-
92
-
93
-
94
-
95
-
96
-
97
-
98
-
99
-
100
-
101
-
102
-
103
-
104
 |
 |

30 SunTrust Banks, Inc. Annual Report 2003
MANAGEMENT’S DISCUSSION continued
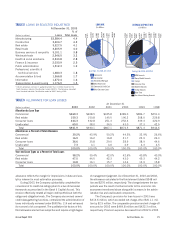
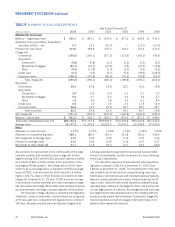
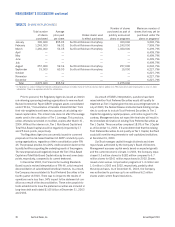
TABLE 10
SUMMARY OF LOAN LOSS EXPERIENCE
Year Ended December 31
(Dollars in millions) 2003 2002 2001 2000 1999 1998
Allowance for Loan Losses
Balance – beginning of year $930.1 $867.1 $ 874.5 $ 871.3 $ 944.6 $ 933.5
Allowance from acquisitions, dispositions
and other activity – net 9.3 15.5 (10.2) — (13.3) (10.0)
Provision for loan losses 313.6 469.8 275.2 134.0 170.4 214.6
Charge-offs
Commercial (195.0) (295.1) (217.3) (115.6) (142.0) (49.0)
Real estate
Construction (0.8) (0.8) (0.3) (0.2) (2.2) (3.2)
Residential mortgages (22.1) (16.7) (10.8) (7.8) (15.0) (13.8)
Other (5.6) (17.8) (5.9) (3.3) (5.2) (5.2)
Credit card (2.7) (1.9) (2.7) (5.4) (78.9) (129.5)
Consumer loans (168.1) (157.8) (89.0) (57.5) (52.8) (63.6)
Total charge-offs (394.3) (490.1) (326.0) (189.8) (296.1) (264.3)
Recoveries
Commercial 39.3 27.8 23.8 22.7 15.5 14.8
Real estate
Construction 0.4 0.4 0.4 0.3 0.7 0.3
Residential mortgages 5.0 3.7 2.2 3.3 3.4 2.7
Other 1.4 3.9 1.8 3.9 6.1 8.4
Credit card 0.5 1.0 1.6 3.1 11.9 14.9
Consumer loans 36.6 31.0 23.8 25.7 28.1 29.7
Total recoveries 83.2 67.8 53.6 59.0 65.7 70.8
Net charge-offs (311.1) (422.3) (272.4) (130.8) (230.4) (193.5)
Balance – end of year $941.9 $930.1 $ 867.1 $ 874.5 $ 871.3 $ 944.6
Total loans outstanding at year end $80,732.3 $73,167.9 $68,959.2 $72,239.8 $66,002.8 $61,540.6
Average loans 76,137.9 71,270.4 70,023.0 70,044.3 62,749.4 57,590.5
Ratios
Allowance to year-end loans 1.17% 1.27% 1.26% 1.21% 1.32% 1.53%
Allowance to nonperforming loans 268.1 182.0 155.4 215.8 350.0 456.0
Net charge-offs to average loans 0.41 0.59 0.39 0.19 0.37 0.34
Provision to average loans 0.41 0.66 0.39 0.19 0.27 0.37
Recoveries to total charge-offs 21.1 13.8 16.4 31.1 22.2 26.8
due primarily to improvement in the credit quality of the large
corporate portfolio that resulted in lower charge-offs for that
segment during 2003 and the 2002 provision expense included
an increase of $45.3 million related to the acquisition of the
Huntington-Florida portfolio. Net charge-offs for 2003 repre-
sented 0.41% of average loans, compared to 0.59% of average
loans for 2002. Loan recoveries for 2003 were $15.4 million
higher, or 22.7%, than in 2002. The ratio of recoveries to total
charge-offs increased to 21.1% from 13.8% due to an increase
in the amount of overall recoveries and lower overall gross charge-
offs. Recoveries and charge-offs for 2003 were favorably impacted
by improvements in the large corporate segment of the portfolio.
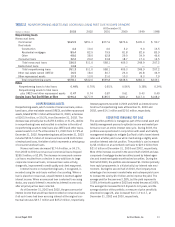
The Company’s charge-off policy is consistent with regulatory
standards. Losses on unsecured consumer loans are recognized
at 90 days past due, compared to the regulatory loss criteria of
120 days. Secured consumer loans are typically charged off at
120 days past due if repayment from all sources has been deter-
mined to be improbable, or at the occurrence of a loss confirming
event (e.g., repossession).
The ratio of the allowance for loan losses to total nonperform-
ing loans increased to 268.1% at December 31, 2003 from
182.0% at December 31, 2002. The improvement in this ratio
was primarily due to the decline in nonperforming loans men-
tioned above. Commercial loans and real estate loans are typically
placed on nonaccrual when principal or interest is past due for 90
days or more, unless the loan is both secured by collateral having
realizable value sufficient to discharge the debt in full and the loan
is in the legal process of collection. Accordingly, secured loans may
be charged down to the estimated value of the collateral with pre-
viously accrued unpaid interest reversed. Subsequent charge-offs
may be required as a result of changes in the market value of col-
lateral or other repayment prospects.