SunTrust 2003 Annual Report Download - page 45
Download and view the complete annual report
Please find page 45 of the 2003 SunTrust annual report below. You can navigate through the pages in the report by either clicking on the pages listed below, or by using the keyword search tool below to find specific information within the annual report.-
 1
1 -
2
-
3
-
4
-
5
-
6
-
7
-
8
-
9
-
10
-
11
-
12
-
13
-
14
-
15
-
16
-
17
-
18
-
19
-
20
-
21
-
22
-
23
-
24
-
25
-
26
-
27
-
28
-
29
-
30
-
31
-
32
-
33
-
34
-
 35
35 -
 36
36 -
 37
37 -
 38
38 -
 39
39 -
 40
40 -
 41
41 -
 42
42 -
 43
43 -
 44
44 -
 45
45 -
 46
46 -
 47
47 -
 48
48 -
 49
49 -
 50
50 -
 51
51 -
 52
52 -
 53
53 -
 54
54 -
 55
55 -
56
-
57
-
58
-
59
-
60
-
61
-
62
-
63
-
64
-
65
-
66
-
67
-
68
-
69
-
70
-
71
-
72
-
73
-
74
-
75
-
76
-
77
-
78
-
79
-
80
-
81
-
82
-
83
-
84
-
85
-
86
-
87
-
88
-
89
-
90
-
91
-
92
-
93
-
94
-
95
-
96
-
97
-
98
-
99
-
100
-
101
-
102
-
103
-
104
 |
 |

Annual Report 2003 SunTrust Banks, Inc. 43
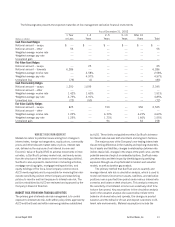
the current behavior of these products. The impact of the
change shortened the duration of these products to reflect the
sharp increase in balances that may be temporary, and at a
minimum, are highly volatile. Shortening the duration of the
deposit base decreased EVE’s exposure to declining rates, and
at the same time decreased the benefit EVE would have in ris-
ing rates. Actions taken to mitigate EVE’s exposure to declining
rates were the same as those noted for net interest income sen-
sitivity previously: extending investment portfolio duration and
reducing liability duration through swapping debt from longer
to shorter durations. The change in indeterminate deposit
methodology and actions to mitigate exposure to lower rates
significantly reduced the market value volatility for 2003 com-
pared to 2002.
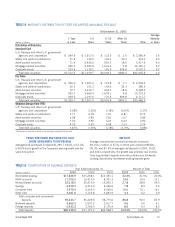
The net interest income simulation and valuation analyses
(EVE) do not necessarily include certain actions that manage-
ment may undertake to manage this risk in response to
anticipated changes in interest rates.
TRADING ACTIVITIES
Most of the Company’s trading activities are designed to support
secondary trading with customers rather than for the purpose of
positioning itself to profit from market movements. Product offer-
ings include the sale of debt securities, including loans traded in
the secondary market, equity securities, derivatives and foreign
exchange contracts, and similar financial instruments. The
Company also participates in underwritings and acts as a market
maker in certain equity securities. Also, in the normal course of
business, the Company maintains an inventory of securities to
support secondary trading. When executing orders on behalf of
customers, which are not sold out of inventory, such as deriva-
tives, the Company enters into subsequent transactions to
manage the resulting risk in accordance with approved limits.
The Company has developed policies and procedures to
manage market risk associated with trading, capital markets and
foreign exchange activities using a value-at-risk (VaR) approach
that combines interest rate risk, equity risk, foreign exchange risk,
spread risk and volatility risk. For trading portfolios, VaR meas-
ures the maximum fair value the Company could lose on a trading
position, given a specified confidence level and time horizon.
VaR limits and exposures are monitored daily for each significant
trading portfolio. The Company’s VaR calculation measures the
potential losses in fair value using a 99% confidence level. This
equates to 2.33 standard deviations from the mean under a nor-
mal distribution. This means that, on average, daily profits and
losses are expected to exceed VaR one out of every 100 overnight
trading days. The VaR methodology includes holding periods for
each position based upon an assessment of relative trading mar-
ket liquidity. For the Foreign Exchange and Derivatives desks, the
Company estimates VaR by applying the Monte Carlo simulation
platform as designed by RiskMetrics,™ and for the estimate of
the Fixed Income and Equity desks’ VaR, the Company uses
Bloomberg™ analytics. The Company uses internally devel-
oped methodology to estimate VaR for credit derivatives and
loan trading.
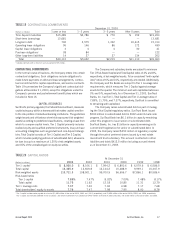
The estimated average combined Undiversified VaR
(Undiversified VaR represents a simple summation of the VaR
calculated across each Desk) was $1.8 million for 2003 and
$2.4 million for 2002. Trading assets net of trading liabilities
averaged $796.3 million for 2003 and $898.7 million for
2002. The estimated combined period-end Undiversified VaR
was $1.3 million at December 31, 2003 and $1.4 million at
December 31, 2002. Trading assets net of trading liabilities
were $804.6 million at December 31, 2003 and $787.1 million
at December 31, 2002.
OTHER MARKET RISK
Other sources of market risk include mortgage servicing rights
(MSRs) and the risk associated with holding mortgage loans
prior to selling them (mortgage warehouse) into the secondary
market, and commitments to customers to make mortgage loans
(mortgage pipeline) that will be sold to the secondary market.
The value of the MSRs asset is dependent upon the
assumed prepayment speed of the mortgage servicing portfolio.
Future expected net cash flows from servicing a loan in the serv-
icing portfolio would not be realized if the loan pays off earlier
than anticipated. MSRs are the discounted present value of
future net cash flows that are expected to be received from the
servicing portfolio. Accordingly, prepayment risk subjects the
MSRs to impairment risk. The Company does not specifically
hedge the MSRs asset for the potential impairment risk; it does
however employ a balanced business strategy using the natural
counter-cyclicality of servicing and production to mitigate the
cost of higher MSR amortization resulting from prepayments.
The fair value determination, key economic assumptions and
the sensitivity of the current fair value of the MSRs as of
December 31, 2003 is discussed in greater detail in Note 12.
The Company hedges the risks associated with the mort-
gage warehouse and pipeline. The mortgage warehouse and
pipeline consist primarily of fixed and adjustable-rate single
family residential real estate loans. The risk associated with the
mortgage warehouse and pipeline is the potential change in
interest rates between the time the customer locks in the rate
on the loan and the time the loan is sold. This period is usually
90-150 days. To hedge this risk, forward sales agreements and
option contracts are executed. The Company has set exposure
limits on the risk associated with the changes in market value of
the mortgage warehouse and pipeline. The limit is based on a
percentage of the aggregate mortgage warehouse and pipeline
for price movements within two standard deviations.
The Company is also subject to risk from changes in equity
prices that arise from owning The Coca-Cola Company common
stock. SunTrust owns 48,266,496 shares of common stock of
The Coca-Cola Company, which had a carrying value of $2.4 bil-
lion at December 31, 2003. A 10% decrease in share price of
The Coca-Cola Company common stock at December 31, 2003
would result in a decrease, net of deferred taxes, of approximately
$159 million in accumulated other comprehensive income.