SunTrust 2003 Annual Report Download - page 68
Download and view the complete annual report
Please find page 68 of the 2003 SunTrust annual report below. You can navigate through the pages in the report by either clicking on the pages listed below, or by using the keyword search tool below to find specific information within the annual report.-
 1
1 -
2
-
3
-
4
-
5
-
6
-
7
-
8
-
9
-
10
-
11
-
12
-
13
-
14
-
15
-
16
-
17
-
18
-
19
-
20
-
21
-
22
-
23
-
24
-
25
-
26
-
27
-
28
-
29
-
30
-
31
-
32
-
33
-
34
-
35
-
36
-
37
-
38
-
39
-
40
-
41
-
42
-
43
-
44
-
45
-
46
-
47
-
48
-
49
-
50
-
51
-
52
-
53
-
54
-
55
-
56
-
57
-
 58
58 -
 59
59 -
 60
60 -
 61
61 -
 62
62 -
 63
63 -
 64
64 -
 65
65 -
 66
66 -
 67
67 -
 68
68 -
 69
69 -
 70
70 -
 71
71 -
 72
72 -
 73
73 -
 74
74 -
 75
75 -
 76
76 -
 77
77 -
 78
78 -
79
-
80
-
81
-
82
-
83
-
84
-
85
-
86
-
87
-
88
-
89
-
90
-
91
-
92
-
93
-
94
-
95
-
96
-
97
-
98
-
99
-
100
-
101
-
102
-
103
-
104
 |
 |

66 SunTrust Banks, Inc. Annual Report 2003
NOTES TO CONSOLIDATED FINANCIAL STATEMENTS continued
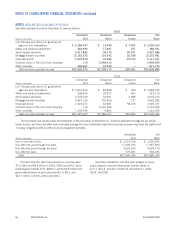
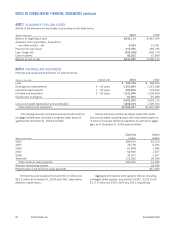
NOTE 5
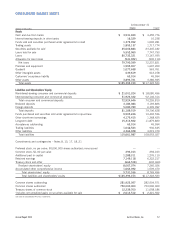
SECURITIES AVAILABLE FOR SALE
Securities available for sale at December 31 were as follows:
2003
Amortized Unrealized Unrealized Fair
(Dollars in thousands) Cost Gains Losses Value
U.S. Treasury and other U.S. government
agencies and corporations $2,286,427 $ 13,959 $ 7,872 $ 2,292,514
States and political subdivisions 362,995 17,807 271 380,531
Asset-backed securities 5,417,882 36,175 26,071 5,427,986
Mortgage-backed securities 12,181,073 119,342 26,934 12,273,481
Corporate bonds 2,097,218 43,966 29,513 2,111,671
Common stock of The Coca-Cola Company 110 2,449,415 — 2,449,525
Other securities 646,667 24,509 — 671,176
Total securities available for sale $22,992,372 $2,705,173 $90,661 $25,606,884
2002
Amortized Unrealized Unrealized Fair
(Dollars in thousands) Cost Gains Losses Value
U.S. Treasury and other U.S. government
agencies and corporations $ 3,601,544 $ 82,828 $ 360 $ 3,684,012
States and political subdivisions 398,640 20,877 407 419,110
Asset-backed securities 4,478,169 44,961 4,986 4,518,144
Mortgage-backed securities 9,467,150 155,660 727 9,622,083
Corporate bonds 1,923,471 64,681 58,415 1,929,737
Common stock of The Coca-Cola Company 110 2,110,584 — 2,110,694
Other securities 1,154,536 6,866 — 1,161,402
Total securities available for sale $21,023,620 $2,486,457 $64,895 $23,445,182
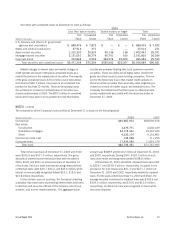
The amortized cost and fair value of investments in debt securities at December 31, 2003 by estimated average life are shown
below. Actual cash flows will differ from estimated average lives and contractual maturities because borrowers may have the right to call
or prepay obligations with or without call or prepayment penalties.
Amortized Fair
(Dollars in thousands) Cost Value
Due in one year or less $ 1,512,410 $ 1,529,655
Due after one year through five years 17,249,703 17,367,564
Due after five years through ten years 3,003,515 3,025,770
Due after ten years 579,967 563,194
Total $22,345,595 $22,486,183
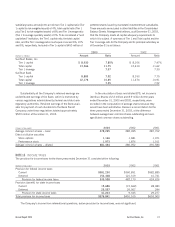
Proceeds from the sale of investments in securities were
$7.6, $5.6 and $5.4 billion in 2003, 2002 and 2001. Gross
realized gains were $124.9, $206.5, and $166.8 million and
gross realized losses on such sales were $1.0, $2.0, and
$13.7 million in 2003, 2002, and 2001.
Securities available for sale that were pledged to secure
public deposits, trust and other funds had fair values of
$13.7, $14.2, and $12.9 billion at December 31, 2003,
2002, and 2001.