SunTrust 2003 Annual Report Download - page 30
Download and view the complete annual report
Please find page 30 of the 2003 SunTrust annual report below. You can navigate through the pages in the report by either clicking on the pages listed below, or by using the keyword search tool below to find specific information within the annual report.-
 1
1 -
2
-
3
-
4
-
5
-
6
-
7
-
8
-
9
-
10
-
11
-
12
-
13
-
14
-
15
-
16
-
17
-
18
-
19
-
 20
20 -
 21
21 -
 22
22 -
 23
23 -
 24
24 -
 25
25 -
 26
26 -
 27
27 -
 28
28 -
 29
29 -
 30
30 -
 31
31 -
 32
32 -
 33
33 -
 34
34 -
 35
35 -
 36
36 -
 37
37 -
 38
38 -
 39
39 -
 40
40 -
41
-
42
-
43
-
44
-
45
-
46
-
47
-
48
-
49
-
50
-
51
-
52
-
53
-
54
-
55
-
56
-
57
-
58
-
59
-
60
-
61
-
62
-
63
-
64
-
65
-
66
-
67
-
68
-
69
-
70
-
71
-
72
-
73
-
74
-
75
-
76
-
77
-
78
-
79
-
80
-
81
-
82
-
83
-
84
-
85
-
86
-
87
-
88
-
89
-
90
-
91
-
92
-
93
-
94
-
95
-
96
-
97
-
98
-
99
-
100
-
101
-
102
-
103
-
104
 |
 |
28 SunTrust Banks, Inc. Annual Report 2003
MANAGEMENT’S DISCUSSION continued
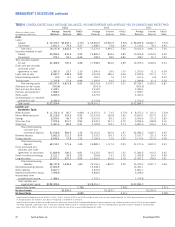
loan type and internal risk rating. The loss migration analysis
provides the basis for factors applied to the commercial and
commercial real estate loan portfolios by examining recent
twelve month loss experience in relation to internal credit risk
ratings over time. Historical loss analyses provide the basis for
factors used for more homogenous pools of smaller loans, such
as residential real estate and other consumer loan categories.
While these analyses that establish the general allowance fac-
tors are formally prepared annually, the Company continuously
monitors credit quality in all portfolio segments and may revise
the general factors whenever necessary in order to address
improving or deteriorating credit quality trends or specific risks
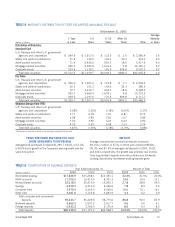
associated with any given loan category. As of December 31,
2003 and 2002, the general allowance calculations totaled
$565 million and $537 million, respectively. The increase
between the periods was primarily the result of the increase
in the overall pooled loan population.
The third element is based on the guidance of various Joint
Interagency Statements issued by bank regulatory agencies and
includes environmental and unallocated components that are not
otherwise evaluated in the first two elements. The environmental
component includes assessments of economic, concentration,
administrative and country transfer risks. The economic risk
assessment considers periodic changes in several widely publi-
cized U.S. economic indicators. This process was enhanced
during 2003 after an analysis of the relationship between specific
economic indicators and historical charge-off levels. The concen-
tration risk methodology considers credit exposure when grouped
by borrower, collateral type, region and industry, and estimates
the incremental risks (see Note 19 for additional details of credit
concentration and Table 8 for Loans by Selected Industries).
Administrative risks are related to specific changes in the organi-
zation or loan portfolio, such as reorganization or centralization
efforts and acquisitions, along with changes in credit policy or
client selection criteria. The unallocated component of the
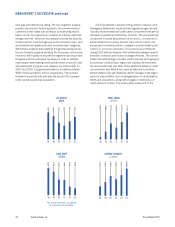
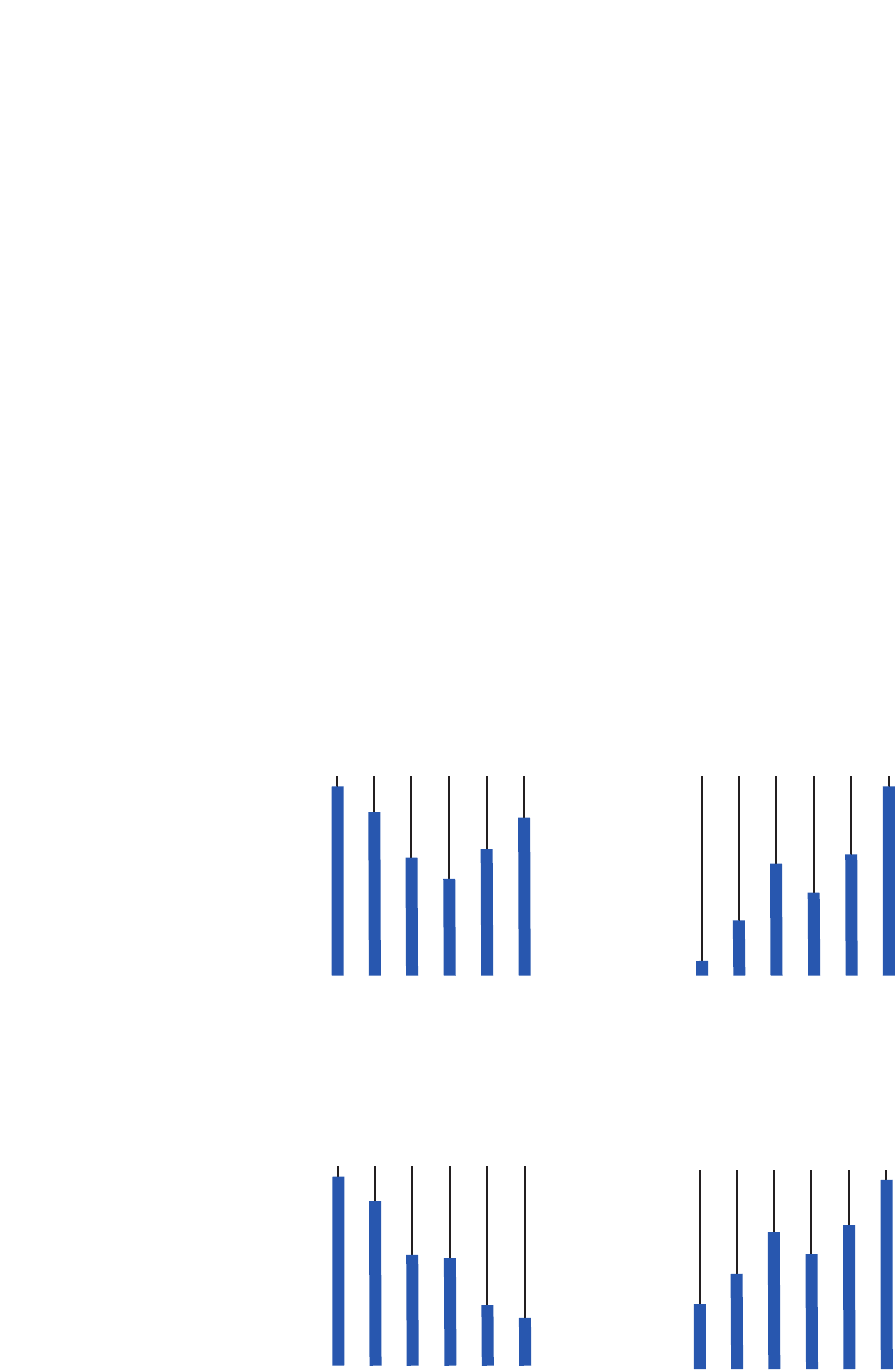
EFFICIENCY
RATIO
%
98 99 00 01 02 03
62.02
60.35
57.47
56.12
57.99
59.99
CORE STAFF
LEVELS
Year-end core staff levels are adjusted
for acquisitions and divestitures.
98 99 00 01 02 03
30,991
30,233
28,513
28,463
26,863
26,455
AVERAGE DEPOSITS
$ in Millions
98 99 00 01 02 03
53,725.3
57,842.1
66,691.9
64,568.7
71,157.2
80,039.0
TOTAL LOANS
$ in Millions
98 99 00 01 02 03
61,540.6
66,002.8
72,239.8
68,959.2
73,167.9
80,732.3