SunTrust 2003 Annual Report Download - page 29
Download and view the complete annual report
Please find page 29 of the 2003 SunTrust annual report below. You can navigate through the pages in the report by either clicking on the pages listed below, or by using the keyword search tool below to find specific information within the annual report.-
 1
1 -
2
-
3
-
4
-
5
-
6
-
7
-
8
-
9
-
10
-
11
-
12
-
13
-
14
-
15
-
16
-
17
-
18
-
 19
19 -
 20
20 -
 21
21 -
 22
22 -
 23
23 -
 24
24 -
 25
25 -
 26
26 -
 27
27 -
 28
28 -
 29
29 -
 30
30 -
 31
31 -
 32
32 -
 33
33 -
 34
34 -
 35
35 -
 36
36 -
 37
37 -
 38
38 -
 39
39 -
40
-
41
-
42
-
43
-
44
-
45
-
46
-
47
-
48
-
49
-
50
-
51
-
52
-
53
-
54
-
55
-
56
-
57
-
58
-
59
-
60
-
61
-
62
-
63
-
64
-
65
-
66
-
67
-
68
-
69
-
70
-
71
-
72
-
73
-
74
-
75
-
76
-
77
-
78
-
79
-
80
-
81
-
82
-
83
-
84
-
85
-
86
-
87
-
88
-
89
-
90
-
91
-
92
-
93
-
94
-
95
-
96
-
97
-
98
-
99
-
100
-
101
-
102
-
103
-
104
 |
 |

Annual Report 2003 SunTrust Banks, Inc. 27
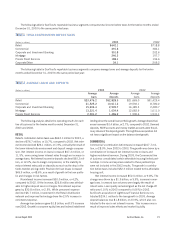
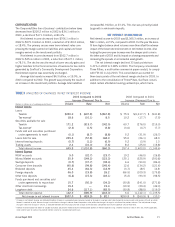
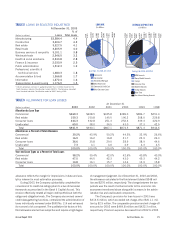
TABLE 7
LOAN PORTFOLIO BY TYPES OF LOANS
At December 31
(Dollars in millions) 2003 2002 2001 2000 1999 1998
Commercial $30,681.9 $28,693.6 $28,945.9 $30,781.1 $26,933.5 $24,589.6
Real estate
Construction 4,479.8 4,002.4 3,627.3 2,966.1 2,457.1 2,085.0
Residential mortgages 24,173.4 19,443.4 17,297.1 19,953.0 19,619.3 16,880.9
Other 9,330.1 9,101.8 8,152.0 8,121.4 7,794.9 8,254.3
Credit card 133.0 111.3 92.0 76.8 77.4 1,563.5
Consumer loans 11,934.1 11,815.4 10,844.9 10,341.4 9,120.6 8,167.3
Total loans $80,732.3 $73,167.9 $68,959.2 $72,239.8 $66,002.8 $61,540.6
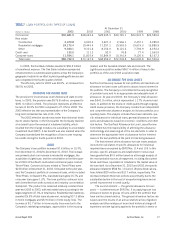
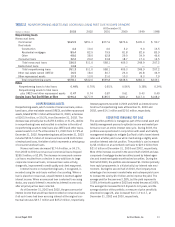
In 2002, the One Bank initiative resulted in $56.2 million
of noninterest expense. The One Bank initiative represented
enhancements to customer-based systems across the Company’s
geographic footprint in an effort to yield operating efficiencies and
was completed in the fourth quarter of 2002.
The efficiency ratio for 2003 was 60.0%, an increase from
58.0% for 2002.
PROVISION FOR INCOME TAXES
The provision for income taxes covers federal and state income
taxes. In 2003, the provision was $576.8 million, compared to
$491.5 million in 2002. The provision represents an effective
tax rate of 30.2% for 2003 compared to 27.0% for 2002. The
2003 effective tax rate was representative of the Company’s
long-term normalized tax rate of 30–31%.
The 2002 effective tax rate was lower than historical levels
due to several factors. In the first quarter, the Company realized
a tax benefit upon the reversal of a deferred liability, which
resulted from the change in status of a subsidiary to a real estate
investment trust (REIT). A tax benefit was also realized when the
Company standardized the recognition of low income housing
tax credits during the fourth quarter of 2002.
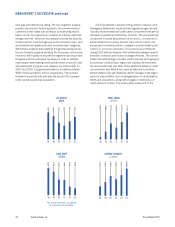
LOANS
The Company’s loan portfolio increased $7.6 billion, or 10.3%,
from December 31, 2002 to December 31, 2003. The increase
was primarily due to an increase in residential mortgages, the
acquisition of Lighthouse, and the consolidation in the third quar-
ter of 2003 of SunTrust’s multi-seller commercial paper conduit,
Three Pillars. Commercial loans related to Three Pillars were
$2.8 billion at December 31, 2003. Compared to the prior year-
end, the Company’s portfolio of commercial loans, which included
Three Pillars, increased 6.9%, real estate loans grew 16.7% and
consumer loans grew 1.0%. The loan portfolio continues to be
well diversified from both a product and industry concentration
standpoint. The product mix remained relatively constant from
year-end 2002 to 2003, with real estate loans accounting for the
largest segment (47.0% of total loans). Residential real estate rep-
resented 29.9% of total loans at year-end, including $17.3 billion
in home mortgages and $6.9 billion in home equity lines. The
increase of $1.7 billion in home equity lines was due to the
Company’s marketing campaigns, appreciation in the housing
market, and the favorable interest rate environment. The
Lighthouse acquisition added $567.4 million of loans to the
portfolio as of the June 2003 acquisition date.
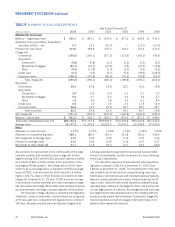
ALLOWANCE FOR LOAN LOSSES
SunTrust continuously reviews its loan portfolio and maintains an
allowance for loan losses sufficient to absorb losses inherent in
the portfolio. The Company is committed to the early recognition
of problem loans and to an appropriate and adequate level of
allowance. At year-end 2003, the Company’s total allowance
was $941.9 million, which represented 1.17% of period-end
loans. In addition to the review of credit quality through ongoing
credit review processes, the Company constructs an independent
and comprehensive allowance analysis for its loan portfolios on a
quarterly basis. The analysis includes three basic elements: spe-
cific allowances for individual loans, general allowances for loan
pools and allowances based on economic conditions and other
risk factors. The SunTrust Allowance for Loan Losses Review
Committee has the responsibility of affirming the allowance
methodology and assessing all of the risk elements in order to
determine the appropriate level of allowance for the inherent
losses in the loan portfolio at the point in time being reviewed.
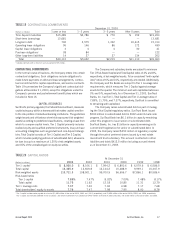
The first element of the allowance for loan losses analysis
involves the calculation of specific allowances for individual
impaired loans as required by SFAS Nos. 114 and 118. In this
process, specific allowances are established for nonaccrual
loans greater than $0.5 million based on a thorough analysis of
the most probable sources of repayment, including discounted
future cash flows, liquidation of collateral or the market value of
the loan itself. As of December 31, 2003 and 2002, the specific
allowance related to SFAS No. 114 and 118 prescribed calcula-
tions totaled $29 million and $117 million, respectively. The
decrease between these two periods was primarily due to the
substantial decline in the level of nonperforming loans and an
overall improvement in credit quality.
The second element — the general allowance for loan
pools — is determined per SFAS No. 5 by applying loan loss
allowance factors to groups of loans within the portfolio that
have similar characteristics. The general allowance factors are
based upon the results of an annual statistical loss migration
analysis and other analyses of recent and historical charge-off
experience and are typically applied to the portfolio in terms of