SunTrust 2003 Annual Report Download - page 34
Download and view the complete annual report
Please find page 34 of the 2003 SunTrust annual report below. You can navigate through the pages in the report by either clicking on the pages listed below, or by using the keyword search tool below to find specific information within the annual report.-
 1
1 -
2
-
3
-
4
-
5
-
6
-
7
-
8
-
9
-
10
-
11
-
12
-
13
-
14
-
15
-
16
-
17
-
18
-
19
-
20
-
21
-
22
-
23
-
 24
24 -
 25
25 -
 26
26 -
 27
27 -
 28
28 -
 29
29 -
 30
30 -
 31
31 -
 32
32 -
 33
33 -
 34
34 -
 35
35 -
 36
36 -
 37
37 -
 38
38 -
 39
39 -
 40
40 -
 41
41 -
 42
42 -
 43
43 -
 44
44 -
45
-
46
-
47
-
48
-
49
-
50
-
51
-
52
-
53
-
54
-
55
-
56
-
57
-
58
-
59
-
60
-
61
-
62
-
63
-
64
-
65
-
66
-
67
-
68
-
69
-
70
-
71
-
72
-
73
-
74
-
75
-
76
-
77
-
78
-
79
-
80
-
81
-
82
-
83
-
84
-
85
-
86
-
87
-
88
-
89
-
90
-
91
-
92
-
93
-
94
-
95
-
96
-
97
-
98
-
99
-
100
-
101
-
102
-
103
-
104
 |
 |

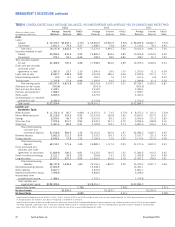
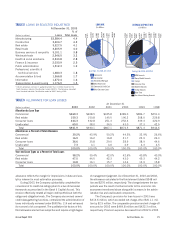
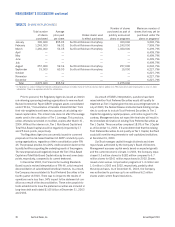
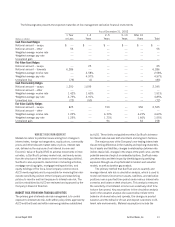
TABLE 13
FUNDS PURCHASED AND SECURITIES SOLD UNDER AGREEMENTS TO REPURCHASE1
Maximum
Outstanding
At December 31 Daily Average at Any
(Dollars in millions) Balance Rate Balance Rate Month-End
2003 $ 9,505.2 0.72% $11,666.9 0.91% $15,089.8
2002 10,402.5 1.01 10,376.2 1.35 12,701.9
2001 10,104.3 1.46 11,283.6 3.65 13,546.6
1Consists of federal funds purchased and securities sold under agreements to repurchase that mature either overnight or at a fixed maturity generally not exceeding three months. Rates on
overnight funds reflect current market rates. Rates on fixed maturity borrowings are set at the time of borrowings.
32 SunTrust Banks, Inc. Annual Report 2003
MANAGEMENT’S DISCUSSION continued
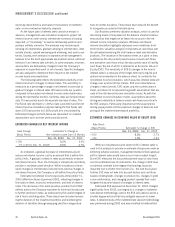
Net securities gains of $123.9 million were realized in 2003
to take advantage of market opportunities while implementing the
Company’s asset and liability management strategy. The carrying
value of the securities portfolio, all of which is classified as “securi-
ties available for sale,” reflected $2.6 billion in net unrealized
securities gains at December 31, 2003, including a $2.5 billion
unrealized gain on the Company’s investment in the common
stock of The Coca-Cola Company. The market value of this com-
mon stock increased $338.8 million, while the unrealized gain on
the remainder of the portfolio decreased $145.9 million compared
to December 31, 2002. These changes in market value did not
affect the net income of SunTrust, but were included in accumu-
lated other comprehensive income.
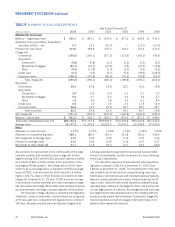
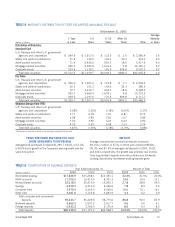
TABLE 12
SECURITIES AVAILABLE FOR SALE
At December 31
Amortized Unrealized Unrealized Fair
(Dollars in millions) Cost Gains Losses Value
U.S. Treasury and other U.S. government
agencies and corporations
2003 $ 2,286.4 $ 14.0 $ 7.9 $ 2,292.5
2002 3,601.5 82.9 0.4 3,684.0
2001 2,229.5 111.2 0.5 2,340.2
States and political subdivisions
2003 363.0 17.8 0.3 380.5
2002 398.6 20.9 0.4 419.1
2001 434.1 11.1 1.5 443.7
Asset-backed securities
2003 5,417.9 36.2 26.1 5,428.0
2002 4,478.2 44.9 5.0 4,518.1
2001 3,508.4 45.5 9.8 3,544.1
Mortgage-backed securities
2003 12,181.1 119.3 26.9 12,273.5
2002 9,467.2 155.6 0.7 9,622.1
2001 8,142.5 163.2 14.0 8,291.7
Corporate bonds
2003 2,097.2 44.0 29.5 2,111.7
2002 1,923.5 64.6 58.4 1,929.7
2001 1,969.5 62.6 48.6 1,983.5
Other securities1
2003 646.8 2,473.9 — 3,120.7
2002 1,154.6 2,117.6 — 3,272.2
2001 740.1 2,313.1 — 3,053.2
Total securities available for sale
2003 $22,992.4 $2,705.2 $90.7 $25,606.9
2002 21,023.6 2,486.5 64.9 23,445.2
2001 17,024.1 2,706.7 74.4 19,656.4
1Includes the Company’s investment in 48,266,496 shares of common stock of The Coca-Cola Company.