SunTrust 2003 Annual Report Download - page 26
Download and view the complete annual report
Please find page 26 of the 2003 SunTrust annual report below. You can navigate through the pages in the report by either clicking on the pages listed below, or by using the keyword search tool below to find specific information within the annual report.-
 1
1 -
2
-
3
-
4
-
5
-
6
-
7
-
8
-
9
-
10
-
11
-
12
-
13
-
14
-
15
-
 16
16 -
 17
17 -
 18
18 -
 19
19 -
 20
20 -
 21
21 -
 22
22 -
 23
23 -
 24
24 -
 25
25 -
 26
26 -
 27
27 -
 28
28 -
 29
29 -
 30
30 -
 31
31 -
 32
32 -
 33
33 -
 34
34 -
 35
35 -
 36
36 -
37
-
38
-
39
-
40
-
41
-
42
-
43
-
44
-
45
-
46
-
47
-
48
-
49
-
50
-
51
-
52
-
53
-
54
-
55
-
56
-
57
-
58
-
59
-
60
-
61
-
62
-
63
-
64
-
65
-
66
-
67
-
68
-
69
-
70
-
71
-
72
-
73
-
74
-
75
-
76
-
77
-
78
-
79
-
80
-
81
-
82
-
83
-
84
-
85
-
86
-
87
-
88
-
89
-
90
-
91
-
92
-
93
-
94
-
95
-
96
-
97
-
98
-
99
-
100
-
101
-
102
-
103
-
104
 |
 |

24 SunTrust Banks, Inc. Annual Report 2003
MANAGEMENT’S DISCUSSION continued
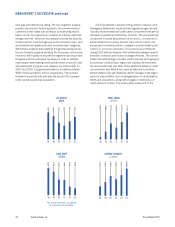
negative one basis point impact on net interest margin for 2003.
The earning asset yield for 2003 declined 96 basis points from
2002. For 2003, loan yields decreased 83 basis points and
securities available for sale yields declined 161 basis points
compared to 2002. In 2003, total interest-bearing liability costs
declined 76 basis points from 2002. The larger decrease in
earning asset yield versus the decrease in liability cost resulted
in the overall net interest margin decline.
The decrease in the margin was due to a number of factors.
The shift in the Company’s balance sheet structure in 2001 and
2002 to a slightly asset-sensitive position in anticipation of rising
rates did not produce the expected margin benefit. This was due to
rates continuing to trend lower during the first half of 2003. After
the Fed reduced the Fed Funds rate mid-year to 1.00%, the yield
curve finally began to steepen late in the third quarter and into the
fourth quarter, helping the fourth quarter margin. SunTrust’s prime
rate averaged 4.12% for 2003, a decline of approximately 55
basis points from 2002. The Federal Reserve Bank Fed Funds rate
averaged 1.12% for the year, 55 basis points below the 2002
average. The lower rates and flattening of the yield curve in the lat-
ter part of 2002 and the first half of 2003 created an acceleration
of prepayments in the mortgage industry. As prepayments acceler-
ated, higher yielding assets were replaced by lower yielding assets,
which reduced the yield on the residential mortgage loan and the
mortgage-backed securities portfolios. The Company’s reposition-
ing of its investment portfolio during 2001 and 2002 shortened
the duration of the portfolio and contributed to the decrease in the
portfolio yield. Net free funding sources, comprised of demand
deposits, equity and other liabilities, net of other assets, are worth
less in a low/declining rate environment, contributing to compres-
sion of the net interest margin. During 2003, the Company began
to moderately increase the duration of the securities portfolio from
1.3 to 2.7 at December 31, 2002 and 2003, respectively. This
moderate increase began to help the margin in the second half of
2003. Duration is a measure of price sensitivity of a bond portfolio
to an immediate change in interest rates. A duration of 2.7 sug-
gests an expected price change of approximately 2.7% for a one
percent change in interest rates, without considering any embed-
ded call or prepayment options.
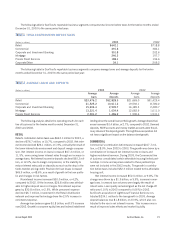
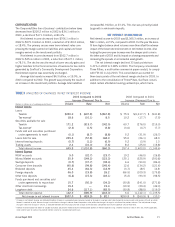
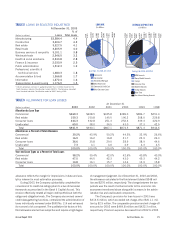
Average earning assets were up 13.4% and average interest-
bearing liabilities increased 12.1% compared to 2002. Average
earning assets and average interest-bearing liabilities each
included $1.3 billion related to Three Pillars for 2003. Average
loans rose $4.9 billion, securities available for sale increased
$4.1 billion, and loans held for sale increased $4.2 billion in
2003. Loans held for sale increased due to increased mortgage
refinancing activity.
The Company continued to take steps to obtain alternative
lower cost funding sources, such as developing initiatives to
grow customer deposits. Campaigns to attract customer deposits
were implemented in 2002 and 2003. The Company believes
that deposit growth has also benefited from the volatility in the
financial markets. Average money market deposits grew 8.5%,
NOW accounts increased 13.4% and demand deposits
increased 16.8% in 2003.
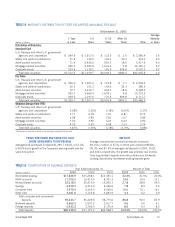
Interest income that the Company was unable to recognize
on nonperforming loans had a negative impact of two basis
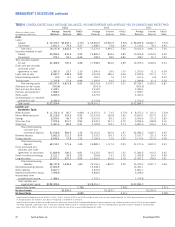
points for 2003 and three basis points for 2002. Table 4
contains more detailed information concerning average loans,
yields and rates paid.
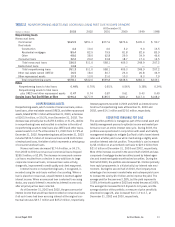
PROVISION FOR LOAN LOSSES
The provision for loan losses charged to expense is based upon
credit loss experience and the results of a detailed analysis estimat-
ing an appropriate and adequate allowance for loan losses. The
analysis includes the evaluation of impaired loans as prescribed
under SFAS Nos. 114 and 118, pooled loans as prescribed under
SFAS No. 5 and economic and other risk factors as outlined in vari-
ous Joint Interagency Statements issued by the bank regulatory
agencies. For the year ended December 31, 2003, the provision for
loan losses was $313.6 million, a decline of $156.2 million, or
33.3%, compared to 2002. The decline was primarily due to
improvement in credit quality during 2003. The 2002 provision for
loan losses also included an additional $45.3 million to bring the
acquired Huntington-Florida loan portfolio into compliance with
SunTrust’s credit standards.
Net charge-offs for 2003 were $311.1 million, a decrease of
$111.2 million, or 26.3%, from 2002. The decline was due to a
$111.6 million, or 41.8%, reduction in commercial net charge-
offs. Commercial charge-offs in 2002 included $74.9 million
related to the bankruptcy of a large corporate energy company.
Net charge-offs related to large corporate loans, generally national
and large business clients with total annual revenues in excess
of $250 million, totaled $115.0 million in 2003, compared to
$241.5 million in 2002. Net charge-offs related to the other
portfolios totaled $196.1 million in 2003 and $180.8 million
in 2002.
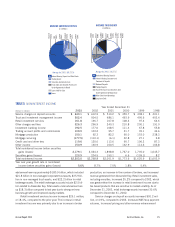
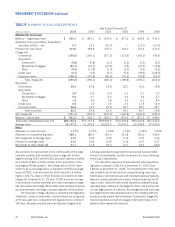
NONINTEREST INCOME
Noninterest income has grown to comprise 41% of total revenues
compared with 36% in 1998. Noninterest income for 2003 was
$2,303.0 million, an increase of 1.5% compared to 2002.
Trust and investment management income decreased
$2.1 million, or 0.4%, compared to 2002. As of December 31,
2003 and 2002, assets under management were approxi-
mately $101.0 billion and $89.6 billion, respectively. Assets
under management increased 12.8% due to appreciation in the
equity markets and net new business. Lost business moder-
ately improved compared to prior periods, while new business
maintained its momentum. Average assets under management
increased 4.1% compared to 2002. The growth in trust and
investment management income was offset by less non-recurring
revenue, primarily estate fees. Assets under management include
individually managed assets, the STI Classic Funds, institutional
assets managed by Trusco Capital Management, and partici-
pant-directed retirement accounts. SunTrust’s total assets under