SunTrust 2003 Annual Report Download - page 39
Download and view the complete annual report
Please find page 39 of the 2003 SunTrust annual report below. You can navigate through the pages in the report by either clicking on the pages listed below, or by using the keyword search tool below to find specific information within the annual report.-
 1
1 -
2
-
3
-
4
-
5
-
6
-
7
-
8
-
9
-
10
-
11
-
12
-
13
-
14
-
15
-
16
-
17
-
18
-
19
-
20
-
21
-
22
-
23
-
24
-
25
-
26
-
27
-
28
-
 29
29 -
 30
30 -
 31
31 -
 32
32 -
 33
33 -
 34
34 -
 35
35 -
 36
36 -
 37
37 -
 38
38 -
 39
39 -
 40
40 -
 41
41 -
 42
42 -
 43
43 -
 44
44 -
 45
45 -
 46
46 -
 47
47 -
 48
48 -
 49
49 -
50
-
51
-
52
-
53
-
54
-
55
-
56
-
57
-
58
-
59
-
60
-
61
-
62
-
63
-
64
-
65
-
66
-
67
-
68
-
69
-
70
-
71
-
72
-
73
-
74
-
75
-
76
-
77
-
78
-
79
-
80
-
81
-
82
-
83
-
84
-
85
-
86
-
87
-
88
-
89
-
90
-
91
-
92
-
93
-
94
-
95
-
96
-
97
-
98
-
99
-
100
-
101
-
102
-
103
-
104
 |
 |

Annual Report 2003 SunTrust Banks, Inc. 37
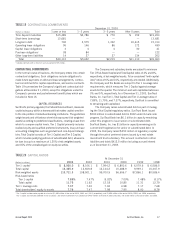
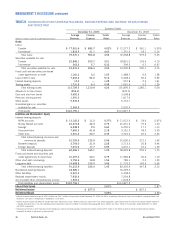
TABLE 19
CONTRACTUAL COMMITMENTS
December 31, 2003
(Dollars in millions) 1 year or less 1 –3 years 3–5 years After 5 years Total
Time deposit maturities $15,489 $2,786 $ 770 $ 159 $19,204
Short-term borrowings 13,681 — — — 13,681
Long-term debt 792 2,575 1,332 10,615 15,314
Operating lease obligations 95 146 86 172 499
Capital lease obligations 3 4 4 30 41
Purchase obligations138 84 — — 122
Other long-term liabilities 14 27 27 134 202
Total $30,112 $5,622 $2,219 $11,110 $49,063
1Includes contracts with a minimum annual payment of $5 million.
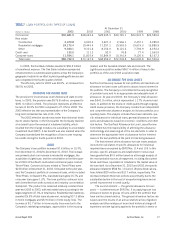
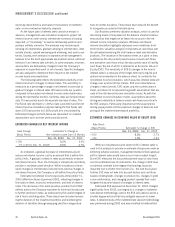
CONTRACTUAL COMMITMENTS
In the normal course of business, the Company enters into certain
contractual obligations. Such obligations include obligations to
make future payments on debt and lease arrangements, contrac-
tual commitments for capital expenditures, and service contracts.
Table 19 summarizes the Company’s significant contractual obli-
gations at December 31, 2003, except for obligations under the
Company’s pension and postretirement benefit plans which are
included in Note 16.
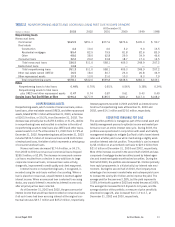
CAPITAL RESOURCES
SunTrust’s primary regulator, the Federal Reserve Board, measures
capital adequacy within a framework that makes capital sensitive
to the risk profiles of individual banking institutions. The guidelines
weight assets and off-balance sheet risk exposures (risk weighted
assets) according to predefined classifications, creating a base from
which to compare capital levels. Tier 1 Capital primarily includes
realized equity and qualified preferred instruments, less purchase
accounting intangibles such as goodwill and core deposit intangi-
bles. Total Capital consists of Tier 1 Capital and Tier 2 Capital,
which includes qualifying portions of subordinated debt, allowance
for loan loss up to a maximum of 1.25% of risk weighted assets,
and 45% of the unrealized gain on equity securities.
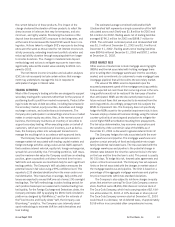
The Company and subsidiary banks are subject to minimum
Tier 1 Risk-Based Capital and Total Capital ratios of 4% and 8%,
respectively, of risk weighted assets. To be considered “well-capital-
ized,” ratios of 6% and 10%, respectively, are needed. Additionally,
the Company and the Banks are subject to Tier 1 Leverage ratio
requirements, which measures Tier 1 Capital against average
assets for the quarter. The minimum and well-capitalized ratios are
3% and 5%, respectively. As of December 31, 2003, SunTrust
Banks, Inc. had Tier 1, Total Capital and Tier 1 Leverage ratios of
7.85%, 11.75%, and 7.37%, respectively. SunTrust is committed
to remaining well capitalized.
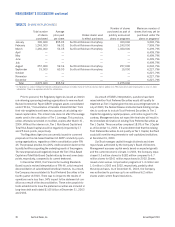
The Company raises subordinated debt as part of manag-
ing the Total Capital regulatory ratios. SunTrust Bank issued
$500 million in subordinated debt in 2002 under its bank note
program. SunTrust Bank has $6.1 billion in capacity remaining
under this program to issue senior or subordinated debt.
SunTrust Banks, Inc. has $1 billion in capacity remaining on its
current shelf registration for senior or subordinated debt. In
2002, the Company raised $350 million of regulatory capital
through the sale of preferred shares issued by a real estate
investment trust subsidiary. This amount is reflected in other
liabilities and totals $412.5 million including accrued interest
as of December 31, 2003.
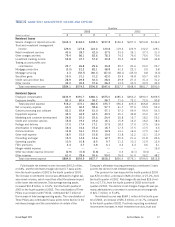
TABLE 20
CAPITAL RATIOS
At December 31
(Dollars in millions) 2003 2002 2001 2000 1999 1998
Tier 1 capital1$8,930.0 $8,106.1 $ 7,994.2 $ 6,850.6 $ 6,579.6 $ 6,586.5
Total capital 13,365.9 12,609.8 12,144.2 10,488.9 9,939.1 10,307.9
Risk-weighted assets 113,711.3 108,501.1 99,700.9 96,656.7 87,866.1 80,586.4
Risk-based ratios
Tier 1 capital 7.85% 7.47% 8.02% 7.09% 7.48% 8.17%
Total capital 11.75 11.62 12.18 10.85 11.31 12.79
Tier 1 leverage ratio 7.37 7.30 7.94 6.98 7.17 7.68
Total shareholders’ equity to assets 7.76 7.47 7.98 7.95 8.00 8.78
1Tier 1 capital includes notes payable to a trust of $1,650 million at the end of 2003, 2002 and 2001, respectively, and $1,050 million at the end of 2000, 1999, and 1998, respectively.
Tier 1 capital also includes preferred shares issued by a real estate investment trust subsidiary of $450 million at the end of 2003 and 2002, and $100 million at the end of 2001 and 2000.