SunTrust 2003 Annual Report Download - page 12
Download and view the complete annual report
Please find page 12 of the 2003 SunTrust annual report below. You can navigate through the pages in the report by either clicking on the pages listed below, or by using the keyword search tool below to find specific information within the annual report.-
 1
1 -
 2
2 -
 3
3 -
 4
4 -
 5
5 -
 6
6 -
 7
7 -
 8
8 -
 9
9 -
 10
10 -
 11
11 -
 12
12 -
 13
13 -
 14
14 -
 15
15 -
 16
16 -
 17
17 -
 18
18 -
 19
19 -
 20
20 -
 21
21 -
 22
22 -
23
-
24
-
25
-
26
-
27
-
28
-
29
-
30
-
31
-
32
-
33
-
34
-
35
-
36
-
37
-
38
-
39
-
40
-
41
-
42
-
43
-
44
-
45
-
46
-
47
-
48
-
49
-
50
-
51
-
52
-
53
-
54
-
55
-
56
-
57
-
58
-
59
-
60
-
61
-
62
-
63
-
64
-
65
-
66
-
67
-
68
-
69
-
70
-
71
-
72
-
73
-
74
-
75
-
76
-
77
-
78
-
79
-
80
-
81
-
82
-
83
-
84
-
85
-
86
-
87
-
88
-
89
-
90
-
91
-
92
-
93
-
94
-
95
-
96
-
97
-
98
-
99
-
100
-
101
-
102
-
103
-
104
 |
 |
10 SunTrust Banks, Inc. Annual Report 2003
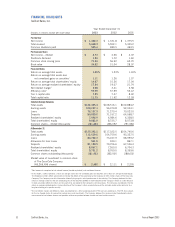
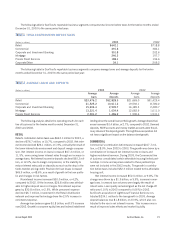
Year Ended December 31
(Dollars in millions except per share data) 2003 2002 2001
For the Year
Net income $ 1,332.3 $ 1,331.8 $ 1,375.5
Total revenue15,668.3 5,552.1 5,345.2
Common dividends paid 505.4 489.5 463.5
Per Common Share
Net income – diluted $ 4.73 $ 4.66 $ 4.72
Dividends declared 1.80 1.72 1.60
Common stock closing price 71.50 56.92 62.70
Book value 34.52 31.04 28.97
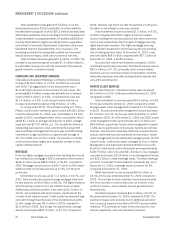
Financial Ratios
Return on average total assets 1.09% 1.23% 1.34%
Return on average total assets less
net unrealized gains on securities21.11 1.26 1.37
Return on average total shareholders’ equity 14.67 15.26 17.04
Return on average realized shareholders’ equity217.54 19.07 21.74
Net interest margin33.08 3.41 3.58
Efficiency ratio359.99 57.99 56.12
Tier 1 capital ratio 7.85 7.47 8.02
Total capital ratio 11.75 11.62 12.18
Selected Average Balances
Total assets $122,325.4 $108,516.1 $102,884.2
Earning assets 109,257.4 96,370.8 92,034.1
Loans 76,137.9 71,270.4 70,023.0
Deposits 80,039.0 71,157.2 64,568.7
Realized shareholders’ equity 7,596.9 6,984.6 6,328.0
Total shareholders’ equity 9,083.0 8,725.7 8,073.8
Common shares – diluted (thousands) 281,434 286,052 291,584
At December 31
Total assets $125,393.2 $117,322.5 $104,740.6
Earning assets 112,519.6 104,759.6 93,327.5
Loans 80,732.3 73,167.9 68,959.2
Allowance for loan losses 941.9 930.1 867.1
Deposits 81,189.5 79,706.6 67,536.4
Realized shareholders’ equity 8,067.1 7,260.0 6,704.3
Total shareholders’ equity 9,731.2 8,769.5 8,359.6
Common shares outstanding (thousands) 281,923 282,505 288,602
Market value of investment in common stock
of The Coca-Cola Company
(48,266,496 shares) $ 2,450 $ 2,111 $ 2,276
1Total revenue is comprised of net interest income (taxable-equivalent) and noninterest income.
2In this report, SunTrust presents a return on average assets less net unrealized gains on securities and a return on average realized equity.
The foregoing numbers reflect adjustments to remove the effects of the ownership by the Company of 48.3 million shares of The Coca-Cola
Company. The Company uses this information internally to gauge its actual performance in the industry. The Company believes that the
return on average assets less the net unrealized gains on the securities portfolio is more indicative of the Company’s return on assets because
it more accurately reflects the return on the assets that are related to the Company’s core businesses. The Company also believes that the
return on average realized equity is more indicative of the Company’s return on equity because the excluded equity relates primarily to a
long-term holding of a specific security.
3The net interest margin and efficiency ratios are presented on a fully taxable-equivalent (FTE) and annualized basis. The FTE basis adjusts
for the tax-favored status of income from certain loans and investments. The Company believes this measure to be the preferred industry
measurement of net interest income and provides relative comparison between taxable and non-taxable amounts.
FINANCIAL HIGHLIGHTS
SunTrust Banks, Inc.