SunTrust 2003 Annual Report Download - page 59
Download and view the complete annual report
Please find page 59 of the 2003 SunTrust annual report below. You can navigate through the pages in the report by either clicking on the pages listed below, or by using the keyword search tool below to find specific information within the annual report.-
 1
1 -
2
-
3
-
4
-
5
-
6
-
7
-
8
-
9
-
10
-
11
-
12
-
13
-
14
-
15
-
16
-
17
-
18
-
19
-
20
-
21
-
22
-
23
-
24
-
25
-
26
-
27
-
28
-
29
-
30
-
31
-
32
-
33
-
34
-
35
-
36
-
37
-
38
-
39
-
40
-
41
-
42
-
43
-
44
-
45
-
46
-
47
-
48
-
 49
49 -
 50
50 -
 51
51 -
 52
52 -
 53
53 -
 54
54 -
 55
55 -
 56
56 -
 57
57 -
 58
58 -
 59
59 -
 60
60 -
 61
61 -
 62
62 -
 63
63 -
 64
64 -
 65
65 -
 66
66 -
 67
67 -
 68
68 -
 69
69 -
70
-
71
-
72
-
73
-
74
-
75
-
76
-
77
-
78
-
79
-
80
-
81
-
82
-
83
-
84
-
85
-
86
-
87
-
88
-
89
-
90
-
91
-
92
-
93
-
94
-
95
-
96
-
97
-
98
-
99
-
100
-
101
-
102
-
103
-
104
 |
 |

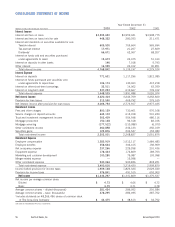
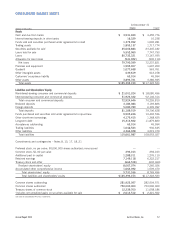
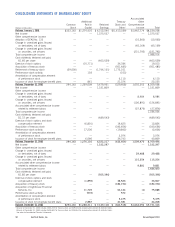
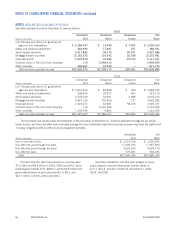
Annual Report 2003 SunTrust Banks, Inc. 57
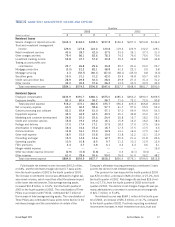
At December 31
(Dollars in thousands) 2003 2002
Assets
Cash and due from banks $3,931,653 $4,455,776
Interest-bearing deposits in other banks 16,329 10,238
Funds sold and securities purchased under agreements to resell 1,373,392 1,092,281
Trading assets 1,853,137 1,717,774
Securities available for sale125,606,884 23,445,182
Loans held for sale 5,552,060 7,747,793
Loans 80,732,321 73,167,935
Allowance for loan losses (941,922) (930,114)
Net loans 79,790,399 72,237,821
Premises and equipment 1,595,307 1,607,200
Goodwill 1,077,638 963,761
Other intangible assets 639,619 612,158
Customers’ acceptance liability 63,014 45,594
Other assets 3,893,721 3,386,945
Total assets $125,393,153 $117,322,523
Liabilities and Shareholders’ Equity
Noninterest-bearing consumer and commercial deposits $21,001,324 $18,080,496
Interest-bearing consumer and commercial deposits 51,923,322 52,146,314
Total consumer and commercial deposits 72,924,646 70,226,810
Brokered deposits 3,184,084 3,169,826
Foreign deposits 5,080,789 6,309,992
Total deposits 81,189,519 79,706,628
Funds purchased and securities sold under agreements to repurchase 9,505,246 10,402,536
Other short-term borrowings 4,175,415 1,368,425
Long-term debt 15,313,922 11,879,820
Acceptances outstanding 63,014 45,594
Trading liabilities 1,048,543 930,645
Other liabilities 4,366,328 4,219,379
Total liabilities 115,661,987 108,553,027
Commitments and contingencies – Notes 8, 13, 17, 18, 21
Preferred stock, no par value; 50,000,000 shares authorized; none issued ——
Common stock, $1.00 par value 294,163 294,163
Additional paid in capital 1,288,311 1,276,110
Retained earnings 7,149,118 6,322,217
Treasury stock and other (664,518) (632,464)
Realized shareholders’ equity 8,067,074 7,260,026
Accumulated other comprehensive income 1,664,092 1,509,470
Total shareholders’ equity 9,731,166 8,769,496
Total liabilities and shareholders’ equity $125,393,153 $117,322,523
Common shares outstanding 281,923,057 282,504,571
Common shares authorized 750,000,000 750,000,000
Treasury shares of common stock 12,239,700 11,658,186
1Includes net unrealized gains on securities available for sale $2,614,512 $2,421,562
See notes to Consolidated Financial Statements.
CONSOLIDATED BALANCE SHEETS