SunTrust 2003 Annual Report Download - page 21
Download and view the complete annual report
Please find page 21 of the 2003 SunTrust annual report below. You can navigate through the pages in the report by either clicking on the pages listed below, or by using the keyword search tool below to find specific information within the annual report.-
 1
1 -
2
-
3
-
4
-
5
-
6
-
7
-
8
-
9
-
10
-
 11
11 -
 12
12 -
 13
13 -
 14
14 -
 15
15 -
 16
16 -
 17
17 -
 18
18 -
 19
19 -
 20
20 -
 21
21 -
 22
22 -
 23
23 -
 24
24 -
 25
25 -
 26
26 -
 27
27 -
 28
28 -
 29
29 -
 30
30 -
 31
31 -
32
-
33
-
34
-
35
-
36
-
37
-
38
-
39
-
40
-
41
-
42
-
43
-
44
-
45
-
46
-
47
-
48
-
49
-
50
-
51
-
52
-
53
-
54
-
55
-
56
-
57
-
58
-
59
-
60
-
61
-
62
-
63
-
64
-
65
-
66
-
67
-
68
-
69
-
70
-
71
-
72
-
73
-
74
-
75
-
76
-
77
-
78
-
79
-
80
-
81
-
82
-
83
-
84
-
85
-
86
-
87
-
88
-
89
-
90
-
91
-
92
-
93
-
94
-
95
-
96
-
97
-
98
-
99
-
100
-
101
-
102
-
103
-
104
 |
 |

Annual Report 2003 SunTrust Banks, Inc. 19
The following analysis details the operating results for each
line of business for the twelve months ended December 31,
2003 and 2002.
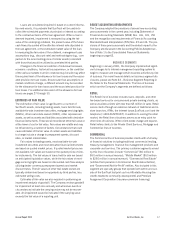
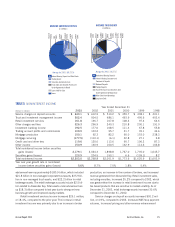
RETAIL
Retail’s contribution before taxes was $642.1 million for 2003, a
decline of $76.7 million, or 10.7%, compared to 2002. Net inter-
est income declined $26.1 million, or 1.9%, primarily the result of
the lower interest rate environment and deposit margin compres-
sion. Net interest income on loans increased $67.2 million, or
11.5%, overcoming lower interest rates through an increase in
average loans. Net interest income for deposits declined $93.3 mil-
lion, or 12.0%, due to margin compression, or the inability to
reduce interest rates paid on deposits as much as the drop in the
funds transfer pricing credit. Provision for loan losses increased
$49.9 million, or 48.6%, as a result of growth in the loan portfo-
lio and changes in risk factors.
Noninterest income increased $30.0 million, or 4.2%,
compared to 2002. Of the increase, $26.8 million was attribut-
able to higher deposit service charges. Noninterest expense
grew by $30.8 million, or 2.5%. While personnel expense
declined $6.7 million, investment in the Retail distribution
network and improved technology drove the 2.5% increase in
noninterest expense.
Average loan balances grew $1.8 billion, an 8.3% increase
over 2002. Growth in consumer equity lines and indirect installment
lending drove the overall loan portfolio growth. Average deposit bal-
ances increased $1.4 billion, or 2.7%, compared to 2002. Demand
deposits, NOW accounts and money market accounts were the pri-
mary drivers of the deposit growth. The Lighthouse acquisition did
not have a significant impact on the balance sheet growth.
COMMERCIAL
Commercial’s contribution before taxes increased $107.7 mil-
lion, or 28.0%, from 2002 to 2003. The growth was driven by a
combination of increased net interest income on loans and
higher noninterest revenue. During 2003, the Commercial line
of business consolidated certain affordable housing limited part-
nerships. Income and expenses related to these partnerships
were not included in the 2002 results. The growth in contribu-
tion before taxes included $52.3 million related to the affordable
housing unit.
Net interest income increased $52.0 million, or 9.8%. The
change was driven by a $1.9 billion, or 9.9%, increase in aver-
age loans. Increased loan volumes were largely the result of
robust sales. Loan quality remained good as the net charge-off
ratio was 0.10% in 2003 compared to 0.06% in 2002.
SunTrust’s acquisition of Lighthouse Financial Services con-
tributed $234.1 million to the loan growth in 2003. Average
deposit balances rose $1.8 billion, or 20.9%, which also con-
tributed to the rise in net interest income. This increase was a
result of improved sales efforts and market liquidity.
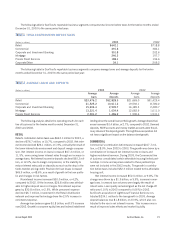
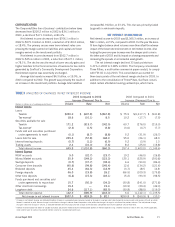
The following table for SunTrust’s reportable business segments compares total income before taxes for the twelve months ended
December 31, 2003 to the same period last year:
TABLE 1
TOTAL CONTRIBUTION BEFORE TAXES
(Dollars in millions) 2003 2002
Retail $642.1 $718.8
Commercial 491.8 384.1
Corporate and Investment Banking 351.8 202.6
Mortgage 246.3 157.7
Private Client Services 188.1 194.6
Corporate/Other 34.1 205.2
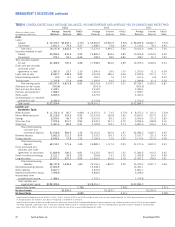
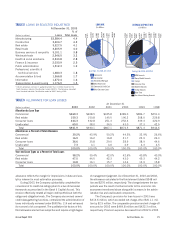
The following table for SunTrust’s reportable business segments compares average loans and average deposits for the twelve
months ended December 31, 2003 to the same period last year:
TABLE 2
AVERAGE LOANS AND DEPOSITS
(Dollars in millions) 2003 2002
Average Average Average Average
loans deposits loans deposits
Retail $23,476.2 $52,828.5 $21,669.0 $51,425.4
Commercial 21,525.2 10,611.2 19,592.1 8,780.2
Corporate and Investment Banking 15,906.4 2,909.7 16,185.3 2,480.7
Mortgage 13,221.4 1,634.4 12,082.9 1,011.0
Private Client Services 2,001.2 1,486.9 1,590.6 1,531.1