SunTrust 2003 Annual Report Download - page 33
Download and view the complete annual report
Please find page 33 of the 2003 SunTrust annual report below. You can navigate through the pages in the report by either clicking on the pages listed below, or by using the keyword search tool below to find specific information within the annual report.-
 1
1 -
2
-
3
-
4
-
5
-
6
-
7
-
8
-
9
-
10
-
11
-
12
-
13
-
14
-
15
-
16
-
17
-
18
-
19
-
20
-
21
-
22
-
 23
23 -
 24
24 -
 25
25 -
 26
26 -
 27
27 -
 28
28 -
 29
29 -
 30
30 -
 31
31 -
 32
32 -
 33
33 -
 34
34 -
 35
35 -
 36
36 -
 37
37 -
 38
38 -
 39
39 -
 40
40 -
 41
41 -
 42
42 -
 43
43 -
44
-
45
-
46
-
47
-
48
-
49
-
50
-
51
-
52
-
53
-
54
-
55
-
56
-
57
-
58
-
59
-
60
-
61
-
62
-
63
-
64
-
65
-
66
-
67
-
68
-
69
-
70
-
71
-
72
-
73
-
74
-
75
-
76
-
77
-
78
-
79
-
80
-
81
-
82
-
83
-
84
-
85
-
86
-
87
-
88
-
89
-
90
-
91
-
92
-
93
-
94
-
95
-
96
-
97
-
98
-
99
-
100
-
101
-
102
-
103
-
104
 |
 |

Annual Report 2003 SunTrust Banks, Inc. 31
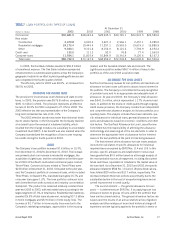
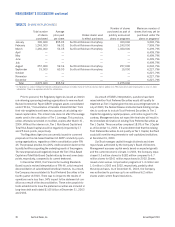
NONPERFORMING ASSETS
Nonperforming assets, which consists of nonaccrual loans, restruc-
tured loans, other real estate owned (OREO), and other repossessed
assets, totaled $378.1 million at December 31, 2003, a decrease
of $163.9 million, or 30.2%, from December 31, 2002. The
decrease was primarily due to a $159.6 million, or 31.2%, decline
in nonperforming loans and resulted in a decline in the ratio of
nonperforming assets to total loans plus OREO and other repos-
sessed assets to 0.47% at December 31, 2003 from 0.74% at
December 31, 2002. Nonperforming loans at December 31, 2003
included $336.5 million of nonaccrual loans and $14.8 million
of restructured loans, the latter of which represents a select group
of consumer workout loans.
Nonaccrual loans decreased $174.4 million, or 34.1%,
from 2002 to 2003 as nonaccrual commercial loans dropped
$185.3 million, or 52.8%. The decrease in nonaccrual commer-
cial loans resulted from a decline in new additions to large
corporate nonaccrual loans, increased loan sales activity,
charge-offs, improvement in credit quality and client repayment.
Interest income on nonperforming loans, if recognized, is
recorded using the cash basis method of accounting. When a
loan is placed on nonaccrual, unpaid interest is reversed against
interest income. When a nonaccrual loan is returned to accruing
status, any unpaid interest is recorded as interest income only
after all principal has been collected.
As of December 31, 2003 and 2002, the gross amount of
interest income that would have been recorded on nonaccrual loans
if all such loans had been accruing interest at the original con-
tractual rate was $33.7 million and $45.2 million, respectively.
Interest payments recorded in 2003 and 2002 as interest income
for all such nonperforming loans at December 31, 2003 and
2002, were $14.1 million and $15.6 million, respectively.
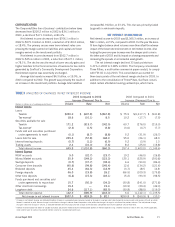
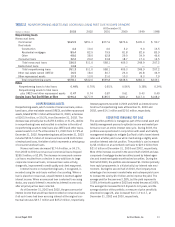
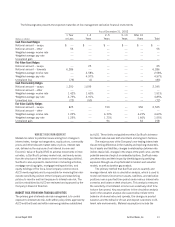
SECURITIES AVAILABLE FOR SALE
The securities portfolio is managed as part of the overall asset and
liability management process to optimize income and market per-
formance over an entire interest rate cycle. During 2003, the
portfolio was repositioned in conjunction with asset and liability
management strategies to mitigate SunTrust’s risk to lower interest
rates and a flatter yield curve while maintaining a slightly asset-
sensitive interest rate risk position. The portfolio’s size increased
by $2.0 billion on an amortized cost basis to $23.0 billion from
$21.0 billion at December 31, 2003 and 2002, respectively.
Most of the increase occurred in the second half of 2003 and was
comprised of mortgage-backed securities issued by federal agen-
cies and investment grade asset-backed securities. During the
first half of 2003, the portfolio size decreased $1.3 billion primarily
from rapid prepayments in a historically low interest rate envi-
ronment. During the second half of 2003, the Company took
advantage of an increase in market rates and a steeper yield curve
to increase the size by $3.3 billion and to improve the yield. The
average yield for the year was 3.28%, but the yield improved to
3.55% in the fourth quarter of 2003 and ended the year at 3.66%.
The average life increased from 2.8 years to 4.0 years, and the
average duration of the portfolio, a measure of price sensitivity
described on page 24, also increased from 1.3 to 2.7, at
December 31, 2002 and 2003, respectively.
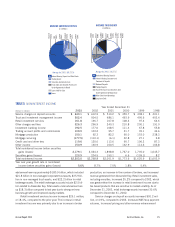
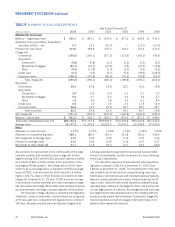
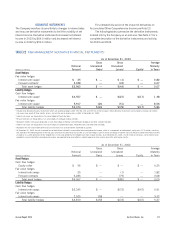
TABLE 11
NONPERFORMING ASSETS AND ACCRUING LOANS PAST DUE 90 DAYS OR MORE
At December 31
(Dollars in millions) 2003 2002 2001 2000 1999 1998
Nonperforming Assets
Nonaccrual loans
Commercial $165.9 $351.3 $377.6 $273.6 $105.0 $ 50.7
Real estate
Construction 4.4 10.0 4.0 2.2 9.0 13.5
Residential mortgages 85.4 82.5 79.9 81.8 82.6 83.9
Other 48.6 38.0 62.8 29.0 34.9 46.6
Consumer loans 32.2 29.2 33.8 18.7 17.4 12.5
Total nonaccrual loans 336.5 511.0 558.1 405.3 248.9 207.2
Restructured loans 14.8 —————
Total nonperforming loans 351.3 511.0 558.1 405.3 248.9 207.2
Other real estate owned (OREO) 16.5 18.0 20.7 23.0 26.8 34.9
Other repossessed assets 10.3 13.0 21.0 10.3 8.3 7.0
Total nonperforming assets $378.1 $542.0 $599.8 $438.6 $284.0 $249.1
Ratios
Nonperforming loans to total loans 0.44% 0.70% 0.81% 0.56% 0.38% 0.34%
Nonperforming assets to total loans
plus OREO and other repossessed assets 0.47 0.74 0.87 0.61 0.43 0.40
Accruing Loans Past Due 90 Days or More $196.4 $177.9 $185.5 $181.2 $117.4 $108.2