SunTrust 2003 Annual Report Download - page 82
Download and view the complete annual report
Please find page 82 of the 2003 SunTrust annual report below. You can navigate through the pages in the report by either clicking on the pages listed below, or by using the keyword search tool below to find specific information within the annual report.-
 1
1 -
2
-
3
-
4
-
5
-
6
-
7
-
8
-
9
-
10
-
11
-
12
-
13
-
14
-
15
-
16
-
17
-
18
-
19
-
20
-
21
-
22
-
23
-
24
-
25
-
26
-
27
-
28
-
29
-
30
-
31
-
32
-
33
-
34
-
35
-
36
-
37
-
38
-
39
-
40
-
41
-
42
-
43
-
44
-
45
-
46
-
47
-
48
-
49
-
50
-
51
-
52
-
53
-
54
-
55
-
56
-
57
-
58
-
59
-
60
-
61
-
62
-
63
-
64
-
65
-
66
-
67
-
68
-
69
-
70
-
71
-
 72
72 -
 73
73 -
 74
74 -
 75
75 -
 76
76 -
 77
77 -
 78
78 -
 79
79 -
 80
80 -
 81
81 -
 82
82 -
 83
83 -
 84
84 -
 85
85 -
 86
86 -
 87
87 -
 88
88 -
 89
89 -
 90
90 -
 91
91 -
 92
92 -
93
-
94
-
95
-
96
-
97
-
98
-
99
-
100
-
101
-
102
-
103
-
104
 |
 |

80 SunTrust Banks, Inc. Annual Report 2003
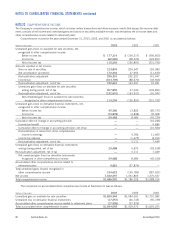
NOTES TO CONSOLIDATED FINANCIAL STATEMENTS continued
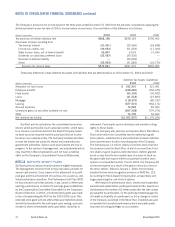
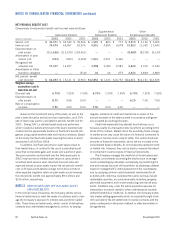
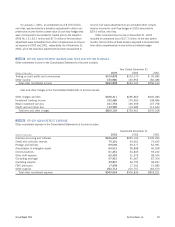
NET PERIODIC BENEFIT COST
Components of net periodic benefit cost (income) were as follows:
Supplemental Other
Retirement Benefits Retirement Benefits Postretirement Benefits
(Dollars in thousands) 2003 2002 2001 2003 2002 2001 2003 2002 2001
Service cost $43,071 $42,530 $ 39,506 $1,520 $823 $ 773 $2,515 $4,146 $ 3,905
Interest cost 74,574 69,067 62,976 4,991 4,995 4,678 10,823 11,052 11,643
Expected return on
plan assets (111,656) (112,670) (103,451) ———(8,489) (8,218) (9,124)
Amortization of prior
service cost (443) (443) (1,422) 1,941 2,201 2,446 ———
Recognized net
actuarial loss 57,307 16,657 — 4,358 3,180 2,581 6,840 3,372 2,443
Amortization of initial
transition obligation ——(510) 44 44 275 2,322 3,809 3,809
Net periodic benefit
cost (income) $62,853 $15,141 $ (2,901) $12,854 $11,243 $10,753 $14,011 $14,161 $12,676
Weighted-average
assumptions used to
determine net cost
Discount rate 6.75% 7.25% 7.50% 6.75% 7.25% 7.50% 6.75% 7.25% 7.50%
Expected return on
plan assets 8.75 9.50 9.50 ———6.25 7.00 7.00
Rate of compensation
increase 3.50 4.00 4.00 3.50 4.00 4.00 ———
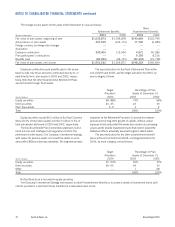
Based on the investment policy of the plans, as well as the
plan’s asset allocation and future return expectation, an 8.75%
rate of return was used to calculate the periodic benefit cost for
2003. During 2003, a detailed asset study was performed
which included a statistical forecast of the plan’s expected rate
of return for the approximate duration of SunTrust’s benefit obli-
gations using capital markets data and historical analysis. Based
on this study, SunTrust anticipates lowering the return on asset
assumption to 8.50% for 2004.
In addition, SunTrust sets pension asset values equal to
their market value, in contrast to the use of a smoothed asset
value that incorporates gains and losses over a period of years.
The poor economic environment over the three years prior to
2003 may have led to inflated asset values in cases where a
smoothed asset value is used. Assumed discount rates and
expected returns on plan assets impact the net periodic benefit
cost. A 25 basis point adverse change to the discount rate or
other expected long-term return on plan assets would increase
the net periodic benefit cost approximately $9.0 million and
$3.8 million, respectively.
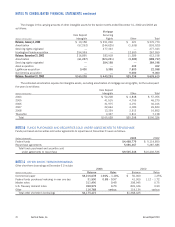
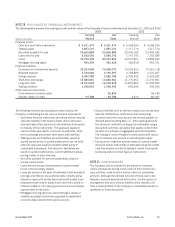
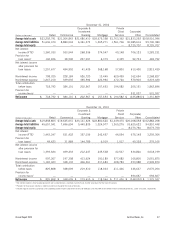
NOTE 17
DERIVATIVES AND OFF-BALANCE SHEET
ARRANGEMENTS
In the normal course of business, the Company utilizes various
financial instruments to meet the needs of customers and to man-
age the Company’s exposure to interest rate and other market
risks. These financial instruments, which consist of derivatives
contracts and credit-related arrangements, involve, to varying
degrees, elements of credit and market risk in excess of the
amount recorded on the balance sheet in accordance with gener-
ally accepted accounting principles.
Credit risk represents the potential loss that may occur
because a party to a transaction fails to perform according to the
terms of the contract. Market risk is the possibility that a change
in market prices may cause the value of a financial instrument to
decrease or become more costly to settle. The contract/notional
amounts of financial instruments, which are not included in the
Consolidated Balance Sheets, do not necessarily represent credit
or market risk. However, they can be used to measure the extent
of involvement in various types of financial instruments.
The Company manages the credit risk of its derivatives and
unfunded commitments by limiting the total amount of arrange-
ments outstanding by individual counterparty; by monitoring the
size and maturity structure of the portfolio; by obtaining collateral
based on management’s credit assessment of the counterparty;
and by applying uniform credit standards maintained for all
activities with credit risk. Collateral held varies but may include
marketable securities, accounts receivable, inventory, property,
plant and equipment, and income-producing commercial prop-
erties. Collateral may cover the entire expected exposure for
transactions or may be called for when credit exposure exceeds
defined thresholds or credit risk. In addition, the Company enters
into master netting agreements which incorporate the right of set-
off to provide for the net settlement of covered contracts with the
same counterparty in the event of default or other termination of
the agreement.