SunTrust 2003 Annual Report Download - page 58
Download and view the complete annual report
Please find page 58 of the 2003 SunTrust annual report below. You can navigate through the pages in the report by either clicking on the pages listed below, or by using the keyword search tool below to find specific information within the annual report.-
 1
1 -
2
-
3
-
4
-
5
-
6
-
7
-
8
-
9
-
10
-
11
-
12
-
13
-
14
-
15
-
16
-
17
-
18
-
19
-
20
-
21
-
22
-
23
-
24
-
25
-
26
-
27
-
28
-
29
-
30
-
31
-
32
-
33
-
34
-
35
-
36
-
37
-
38
-
39
-
40
-
41
-
42
-
43
-
44
-
45
-
46
-
47
-
 48
48 -
 49
49 -
 50
50 -
 51
51 -
 52
52 -
 53
53 -
 54
54 -
 55
55 -
 56
56 -
 57
57 -
 58
58 -
 59
59 -
 60
60 -
 61
61 -
 62
62 -
 63
63 -
 64
64 -
 65
65 -
 66
66 -
 67
67 -
 68
68 -
69
-
70
-
71
-
72
-
73
-
74
-
75
-
76
-
77
-
78
-
79
-
80
-
81
-
82
-
83
-
84
-
85
-
86
-
87
-
88
-
89
-
90
-
91
-
92
-
93
-
94
-
95
-
96
-
97
-
98
-
99
-
100
-
101
-
102
-
103
-
104
 |
 |

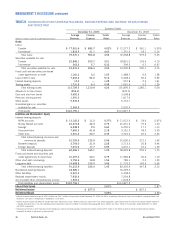
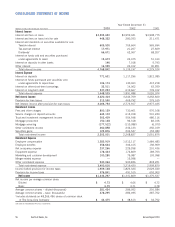
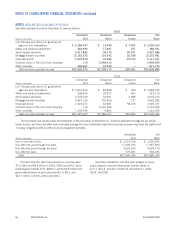
CONSOLIDATED STATEMENTS OF INCOME
56 SunTrust Banks, Inc. Annual Report 2003
Year Ended December 31
(Dollars in thousands except per share data) 2003 2002 2001
Interest Income
Interest and fees on loans $3,593,630 $3,959,041 $4,908,775
Interest and fees on loans held for sale 448,322 280,353 211,471
Interest and dividends on securities available for sale
Taxable interest 609,500 755,664 965,694
Tax-exempt interest 17,971 21,267 27,669
Dividends166,671 62,967 68,207
Interest on funds sold and securities purchased
under agreements to resell 15,673 24,475 51,164
Interest on deposits in other banks 146 7,018 5,743
Other interest 16,929 24,412 40,851
Total interest income 4,768,842 5,135,197 6,279,574
Interest Expense
Interest on deposits 771,631 1,117,296 1,812,385
Interest on funds purchased and securities sold
under agreements to repurchase 106,174 140,463 412,218
Interest on other short-term borrowings 33,511 14,062 63,359
Interest on long-term debt 537,223 619,667 739,012
Total interest expense 1,448,539 1,891,488 3,026,974
Net Interest Income 3,320,303 3,243,709 3,252,600
Provision for loan losses 313,550 469,792 275,165
Net interest income after provision for loan losses 3,006,753 2,773,917 2,977,435
Noninterest Income
Fees and other charges 800,129 730,461 570,168
Service charges on deposit accounts 643,103 612,918 510,249
Trust and investment management income 502,409 504,548 486,116
Mortgage production 150,138 92,318 82,166
Mortgage servicing (177,512) (110,088) (6,073)
Other noninterest income 260,858 234,123 256,169
Securities gains 123,876 204,547 153,080
Total noninterest income 2,303,001 2,268,827 2,051,875
Noninterest Expense
Employee compensation 1,585,919 1,512,117 1,484,483
Employee benefits 358,644 306,415 192,969
Net occupancy expense 237,266 229,258 210,436
Equipment expense 178,443 174,809 189,763
Marketing and customer development 100,280 79,987 103,998
Merger-related expense —15,998 —
Other noninterest expense 940,064 900,836 818,221
Total noninterest expense 3,400,616 3,219,420 2,999,870
Income before provision for income taxes 1,909,138 1,823,324 2,029,440
Provision for income taxes 576,841 491,515 653,903
Net Income $1,332,297 $1,331,809 $1,375,537
Net income per average common share:
Diluted $4.73 $4.66 $ 4.72
Basic 4.79 4.71 4.78
Average common shares – diluted (thousands) 281,434 286,052 291,584
Average common shares – basic (thousands) 278,295 282,495 287,702
1Includes dividends on 48,266,496 shares of common stock
of The Coca-Cola Company $42,475 $38,613 $ 34,752
See notes to Consolidated Financial Statements.