SunTrust 2003 Annual Report Download - page 75
Download and view the complete annual report
Please find page 75 of the 2003 SunTrust annual report below. You can navigate through the pages in the report by either clicking on the pages listed below, or by using the keyword search tool below to find specific information within the annual report.-
 1
1 -
2
-
3
-
4
-
5
-
6
-
7
-
8
-
9
-
10
-
11
-
12
-
13
-
14
-
15
-
16
-
17
-
18
-
19
-
20
-
21
-
22
-
23
-
24
-
25
-
26
-
27
-
28
-
29
-
30
-
31
-
32
-
33
-
34
-
35
-
36
-
37
-
38
-
39
-
40
-
41
-
42
-
43
-
44
-
45
-
46
-
47
-
48
-
49
-
50
-
51
-
52
-
53
-
54
-
55
-
56
-
57
-
58
-
59
-
60
-
61
-
62
-
63
-
64
-
 65
65 -
 66
66 -
 67
67 -
 68
68 -
 69
69 -
 70
70 -
 71
71 -
 72
72 -
 73
73 -
 74
74 -
 75
75 -
 76
76 -
 77
77 -
 78
78 -
 79
79 -
 80
80 -
 81
81 -
 82
82 -
 83
83 -
 84
84 -
 85
85 -
86
-
87
-
88
-
89
-
90
-
91
-
92
-
93
-
94
-
95
-
96
-
97
-
98
-
99
-
100
-
101
-
102
-
103
-
104
 |
 |

Annual Report 2003 SunTrust Banks, Inc. 73
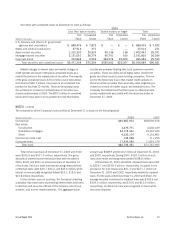
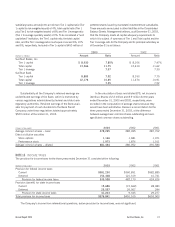
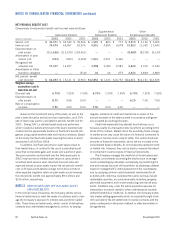
subsidiary banks are subject to a minimum Tier 1 capital ratio (Tier
1 capital to risk-weighted assets) of 4%, total capital ratio (Tier 1
plus Tier 2 to risk-weighted assets) of 8% and Tier 1 leverage ratio
(Tier 1 to average quarterly assets) of 3%. To be considered a “well
capitalized” institution, the Tier 1 capital ratio, the total capital
ratio, and the Tier 1 leverage ratio must equal or exceed 6%, 10%
and 5%, respectively. Included in Tier 1 capital is $450 million of
preferred shares issued by real estate investment trust subsidiaries.
These amounts are included in other liabilities in the Consolidated
Balance Sheets. Management believes, as of December 31, 2003,
that the Company meets all capital adequacy requirements to
which it is subject. A summary of Tier 1 and Total capital and the
Tier 1 leverage ratio for the Company and its principal subsidiary as
of December 31 is as follows:
2003 2002
(Dollars in millions) Amount Ratio Amount Ratio
SunTrust Banks, Inc.
Tier 1 capital $8,930 7.85% $ 8,106 7.47%
Total capital 13,366 11.75 12,610 11.62
Tier 1 leverage 7.37 7.30
SunTrust Bank
Tier 1 capital 8,883 7.92 8,153 7.75
Total capital 12,176 10.85 11,474 10.91
Tier 1 leverage 7.35 7.52
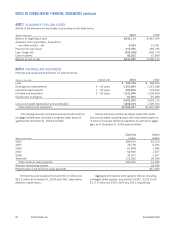
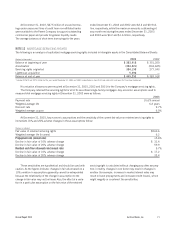
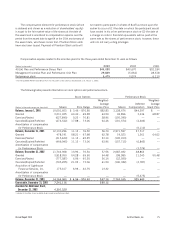
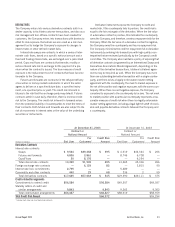
(Shares in thousands) 2003 2002 2001
Average common shares – basic 278,295 282,495 287,702
Effect of dilutive securities
Stock options 1,166 1,681 1,971
Performance stock 1,973 1,876 1,911
Average common shares – diluted 281,434 286,052 291,584
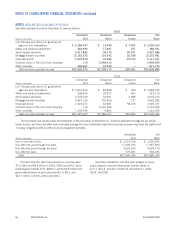
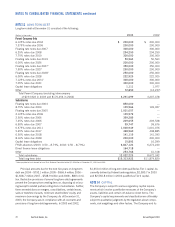
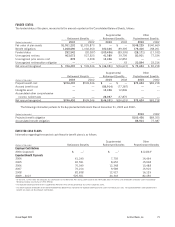
NOTE 15
INCOME TAXES
The provision for income taxes for the three years ended December 31 consisted of the following:
(Dollars in thousands) 2003 2002 2001
Provision for federal income taxes
Current $381,250 $360,851 $582,885
Deferred 154,348 121,319 41,741
Provision for federal income taxes 535,598 482,170 624,626
Provision (benefit) for state income taxes
Current 15,686 (15,662) 28,983
Deferred 25,557 25,007 294
Provision for state income taxes 41,243 9,345 29,277
Total provision for income taxes $576,841 $491,515 $653,903
The Company’s income from international operations, before provision for income taxes, was not significant.
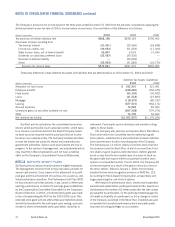
Substantially all the Company’s retained earnings are
undistributed earnings of the Bank, which is restricted by
various regulations administered by federal and state bank
regulatory authorities. Retained earnings of the Bank avail-
able for payment of cash dividends to the Bank Parent
Company under these regulations totaled approximately
$520 million at December 31, 2003.
In the calculation of basic and diluted EPS, net income is
identical. Shares of 2.2 million and 8.9 million for the years
ended December 31, 2003 and 2002, respectively, were
excluded in the computation of average shares because they
would have been antidilutive. Below is a reconciliation for the
three years ended December 31, 2003, of the difference
between average basic common shares outstanding and aver-
age diluted common shares outstanding.