SunTrust 2003 Annual Report Download - page 18
Download and view the complete annual report
Please find page 18 of the 2003 SunTrust annual report below. You can navigate through the pages in the report by either clicking on the pages listed below, or by using the keyword search tool below to find specific information within the annual report.-
 1
1 -
2
-
3
-
4
-
5
-
6
-
7
-
 8
8 -
 9
9 -
 10
10 -
 11
11 -
 12
12 -
 13
13 -
 14
14 -
 15
15 -
 16
16 -
 17
17 -
 18
18 -
 19
19 -
 20
20 -
 21
21 -
 22
22 -
 23
23 -
 24
24 -
 25
25 -
 26
26 -
 27
27 -
 28
28 -
29
-
30
-
31
-
32
-
33
-
34
-
35
-
36
-
37
-
38
-
39
-
40
-
41
-
42
-
43
-
44
-
45
-
46
-
47
-
48
-
49
-
50
-
51
-
52
-
53
-
54
-
55
-
56
-
57
-
58
-
59
-
60
-
61
-
62
-
63
-
64
-
65
-
66
-
67
-
68
-
69
-
70
-
71
-
72
-
73
-
74
-
75
-
76
-
77
-
78
-
79
-
80
-
81
-
82
-
83
-
84
-
85
-
86
-
87
-
88
-
89
-
90
-
91
-
92
-
93
-
94
-
95
-
96
-
97
-
98
-
99
-
100
-
101
-
102
-
103
-
104
 |
 |

16 SunTrust Banks, Inc. Annual Report 2003
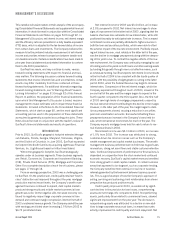
MANAGEMENT’S DISCUSSION continued
charge-offs decreased primarily due to a reduction in commer-
cial net charge-offs.
Controlling noninterest expense continued to be a focus for
SunTrust in 2003. Although the Company benefited from
numerous cost savings initiatives, increased performance based
incentive payments and bonus payouts more than offset expense
reduction efforts. Total noninterest expense increased 5.6% from
2002. Personnel expense continued to be the largest component
of noninterest expense for SunTrust. Most of the increase in per-
sonnel expense related to incentive payments resulting from
business growth, higher production volumes, and higher revenue
in the PCS, CIB and Mortgage lines of business.
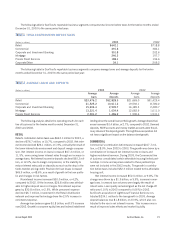
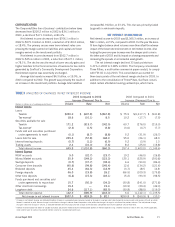
SunTrust experienced moderate loan growth four consecu-
tive quarters in 2003. Residential mortgage loans increased
significantly from 2002 to 2003 partially due to the improve-
ment in adjustable rate mortgage production during 2003.
Commercial middle market produced strong loan growth in
2003, especially given the economic environment. However, the
growth in commercial middle market was masked by shrinkage
in large corporate loans. Average loans within the Commercial
line of business increased 9.9% while average loans in the CIB
line of business decreased 1.7%. The Company anticipates
gradual pick up in the large corporate loan category as the econ-
omy continues to strengthen.
As previously mentioned, the Company took advantage of
wholesale funding sources during 2003 to fund a part of the
earning asset growth. SunTrust also experienced significant
growth in average consumer and commercial deposits which
increased 6.1% over 2002.
The following discussions will provide further insight on the
2003 performance of SunTrust.
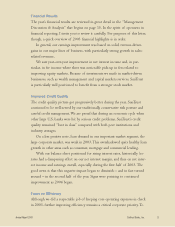
CRITICAL ACCOUNTING POLICIES
The Company’s accounting policies are integral to understanding
the results reported. Accounting policies are described in detail in
Note 1 to the Consolidated Financial Statements. The Company’s
most complex accounting policies require management’s judg-
ment to ascertain the valuation of assets, liabilities, commitments
and contingencies. A variety of factors could affect the ultimate
value that is obtained either when earning income, recognizing an
expense, recovering an asset or reducing a liability. In instances
where required by generally accepted accounting principles, the
Company uses a discount factor to determine the present value of
assets and liabilities. A change in the discount factor could
increase or decrease the values of those assets and liabilities.
That change could result in either a beneficial or adverse impact
on the financial results. The Company has established detailed
policies and control procedures that are intended to ensure valua-
tion methods are well controlled and applied consistently from
period to period. In addition, the policies and procedures are
intended to ensure that the process for changing methodologies
occurs in an appropriate manner. The following is a brief descrip-
tion of the Company’s current accounting policies involving
significant management valuation judgments.
ALLOWANCE FOR LOAN LOSSES
The allowance for loan losses represents management’s esti-
mate of losses inherent in the existing loan portfolio. The
allowance for loan losses is increased by the provision for loan
losses charged to expense and reduced by loans charged off, net
of recoveries. The allowance for loan losses is determined based
on management’s assessment of several factors: reviews and
evaluations of specific loans, changes in the nature and volume
of the loan portfolio, current economic conditions and the related
impact on segments of the loan portfolio, historical loan loss
experience and the level of classified and nonperforming loans.
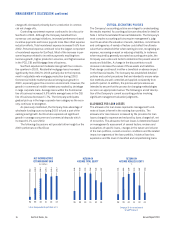
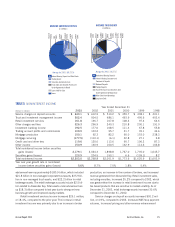
NET INCOME BEFORE
EXTRAORDINARY GAIN
$ in millions
5 Year Compounded Growth Rate 6.5%
98 99 00 01 02 03
971.0
1,124.0
1,294.1
1,375.5
1,331.8
1,332.3
RETURN ON
AVERAGE REALIZED EQUITY
%
See page 14 for reconcilement
to GAAP measure.
98 99 00 01 02 03
17.21
20.83
21.46
21.74
19.07
17.54
RETURN ON
AVERAGE TOTAL EQUITY
%
98 99 00 01 02 03
12.36
16.20
17.25
17.04
15.26
14.67