SunTrust 2003 Annual Report Download - page 27
Download and view the complete annual report
Please find page 27 of the 2003 SunTrust annual report below. You can navigate through the pages in the report by either clicking on the pages listed below, or by using the keyword search tool below to find specific information within the annual report.-
 1
1 -
2
-
3
-
4
-
5
-
6
-
7
-
8
-
9
-
10
-
11
-
12
-
13
-
14
-
15
-
16
-
 17
17 -
 18
18 -
 19
19 -
 20
20 -
 21
21 -
 22
22 -
 23
23 -
 24
24 -
 25
25 -
 26
26 -
 27
27 -
 28
28 -
 29
29 -
 30
30 -
 31
31 -
 32
32 -
 33
33 -
 34
34 -
 35
35 -
 36
36 -
 37
37 -
38
-
39
-
40
-
41
-
42
-
43
-
44
-
45
-
46
-
47
-
48
-
49
-
50
-
51
-
52
-
53
-
54
-
55
-
56
-
57
-
58
-
59
-
60
-
61
-
62
-
63
-
64
-
65
-
66
-
67
-
68
-
69
-
70
-
71
-
72
-
73
-
74
-
75
-
76
-
77
-
78
-
79
-
80
-
81
-
82
-
83
-
84
-
85
-
86
-
87
-
88
-
89
-
90
-
91
-
92
-
93
-
94
-
95
-
96
-
97
-
98
-
99
-
100
-
101
-
102
-
103
-
104
 |
 |
Annual Report 2003 SunTrust Banks, Inc. 25
advisement were approximately $180.9 billion, which included
$21.8 billion in non-managed corporate trust assets, $35.9 bil-
lion in non-managed trust assets, and $22.2 billion in retail
brokerage assets. The retail brokerage accounts include $2.5 bil-
lion related to Alexander Key. Total assets under advisement are
up $18.3 billion compared to last year due to strong net new
business growth and improved equity markets.
Retail investment services income increased $25.1 million,
or 18.4%, compared to the prior year. The increase in retail
investment income was primarily due to an increase in broker
production, an increase in the number of brokers, and increased
revenue generated from Alexander Key. Retail investment sales,
including annuities, increased 25.2% compared to 2002, which
was greater than the increase in retail investment income due to
fee based products that are sensitive to market volatility. As of
December 31, 2003, retail brokerage assets increased 30.6%
compared to December 31, 2002.
Service charges on deposit accounts increased $30.2 mil-
lion, or 4.9%, compared to 2002. Increased NSF/stop payment
volumes, increased pricing and other revenue enhancement
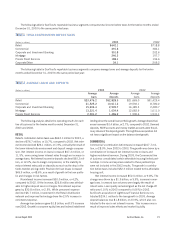
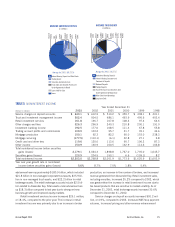
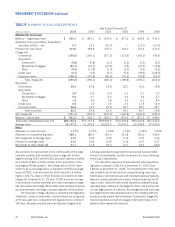
TABLE 5
NONINTEREST INCOME
Year Ended December 31
(Dollars in millions) 2003 2002 2001 2000 1999 1998
Service charges on deposit accounts $643.1 $612.9 $ 510.2 $ 459.7 $ 438.1 $ 401.1
Trust and investment management income 502.4 504.5 486.1 493.9 495.6 453.4
Retail investment services 161.8 136.7 107.8 108.2 97.4 64.6
Other charges and fees 326.3 296.9 240.3 210.8 200.1 191.0
Investment banking income 192.5 177.0 108.5 111.3 67.8 55.8
Trading account profits and commissions 109.9 103.2 95.7 31.7 35.1 44.6
Mortgage production 150.1 92.3 82.2 90.0 153.0 238.3
Mortgage servicing (177.5) (110.1) (6.1) 32.8 27.1 2.8
Credit card and other fees 119.6 120.0 113.6 95.7 106.2 87.3
Other income 150.9 130.9 160.5 132.9 114.6 106.8
Total noninterest income before securities
gains (losses) 2,179.1 2,064.3 1,898.8 1,767.0 1,735.0 1,645.7
Securities gains (losses) 123.9 204.5 153.1 6.6 (109.1) 8.2
Total noninterest income $2,303.0 $2,268.8 $2,051.9 $1,773.6 $1,625.9 $1,653.9
Year over year growth rate in noninterest
income before securities gains (losses) 5.6% 8.7% 7.5% 1.8% 5.4%
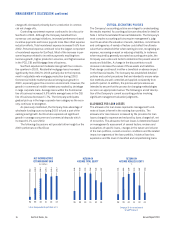
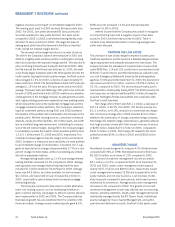
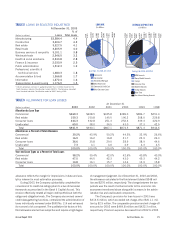
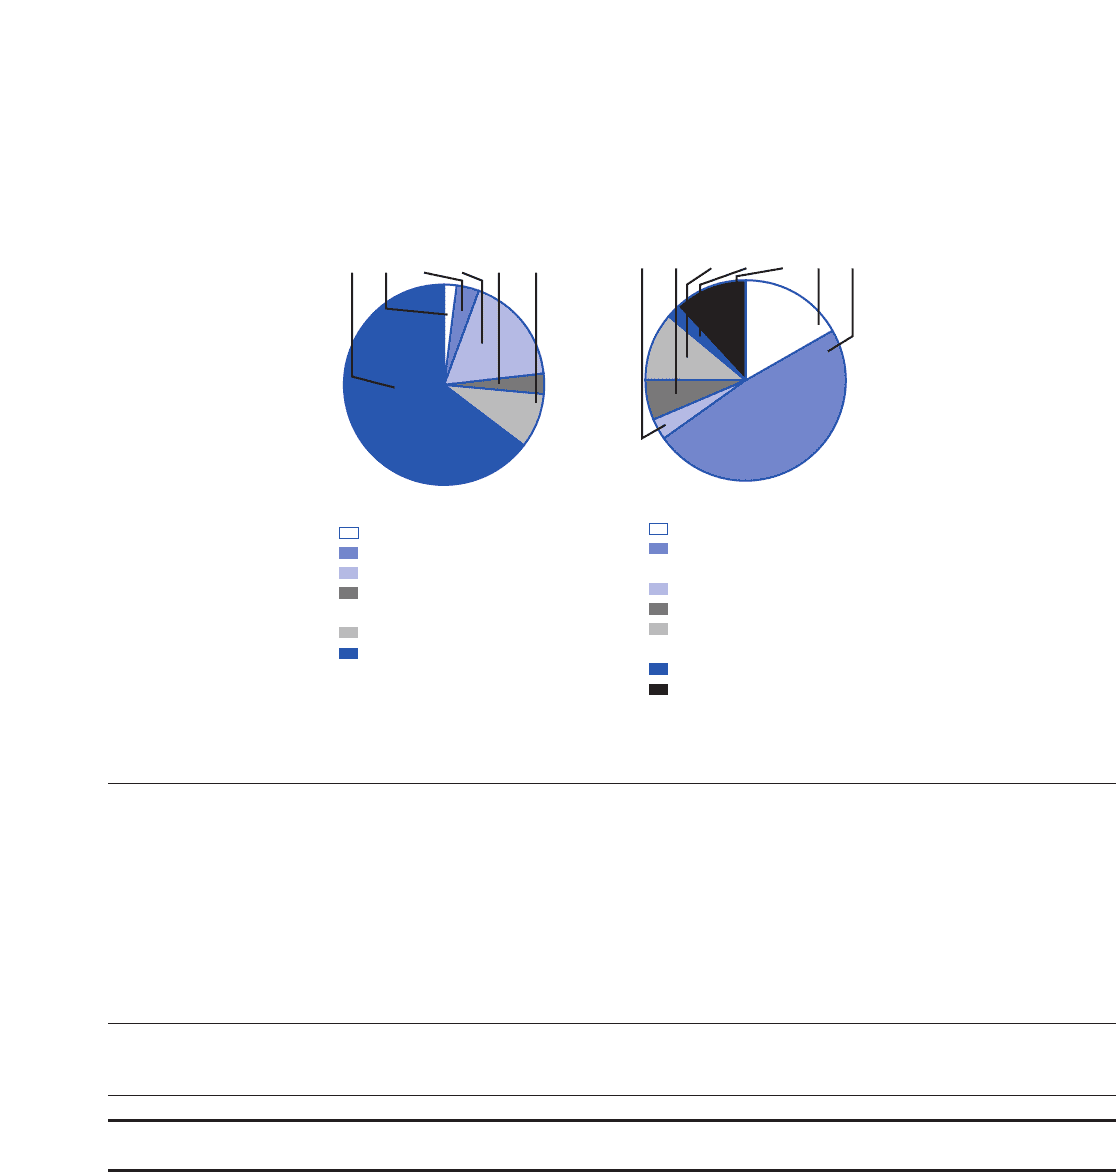
AVERAGE EARNING ASSET MIX
$ in Millions
Average for 2003: 109,257.4
76,137.9
69.68%
10.5
0.01%
1,765.8
1.62%
21,368.5
19.56%
1,387.0
1.27%
8,587.7
7.86%
Interest Bearing Deposits in Other Banks
Trading Assets
Securities Available for Sale
Funds Sold and Securities Purchased
Under Agreements to Resell
Loans Held For Sale
Loans
AVERAGE FUNDING MIX
$ in Millions
Average for 2003: 106,574.7
6,933.3
6.50%
3,662.0
3.44%
11,666.9
10.95%
2,211.7
2.07%
12,657.1
11.88%
17,826.9
16.73%
51,616.8
48.43%
Noninterest Bearing Deposits
Interest-Bearing Consumer and
Commercial Deposits
Brokered Deposits
Foreign Deposits
Funds Purchased and Securities Sold
Under Agreement to Repurchase
Other Short-term Borrowings
Long-term Debt