SunTrust 2003 Annual Report Download - page 80
Download and view the complete annual report
Please find page 80 of the 2003 SunTrust annual report below. You can navigate through the pages in the report by either clicking on the pages listed below, or by using the keyword search tool below to find specific information within the annual report.-
 1
1 -
2
-
3
-
4
-
5
-
6
-
7
-
8
-
9
-
10
-
11
-
12
-
13
-
14
-
15
-
16
-
17
-
18
-
19
-
20
-
21
-
22
-
23
-
24
-
25
-
26
-
27
-
28
-
29
-
30
-
31
-
32
-
33
-
34
-
35
-
36
-
37
-
38
-
39
-
40
-
41
-
42
-
43
-
44
-
45
-
46
-
47
-
48
-
49
-
50
-
51
-
52
-
53
-
54
-
55
-
56
-
57
-
58
-
59
-
60
-
61
-
62
-
63
-
64
-
65
-
66
-
67
-
68
-
69
-
 70
70 -
 71
71 -
 72
72 -
 73
73 -
 74
74 -
 75
75 -
 76
76 -
 77
77 -
 78
78 -
 79
79 -
 80
80 -
 81
81 -
 82
82 -
 83
83 -
 84
84 -
 85
85 -
 86
86 -
 87
87 -
 88
88 -
 89
89 -
 90
90 -
91
-
92
-
93
-
94
-
95
-
96
-
97
-
98
-
99
-
100
-
101
-
102
-
103
-
104
 |
 |

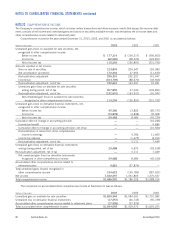
78 SunTrust Banks, Inc. Annual Report 2003
NOTES TO CONSOLIDATED FINANCIAL STATEMENTS continued
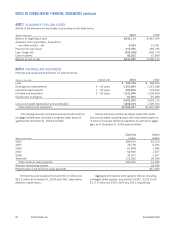
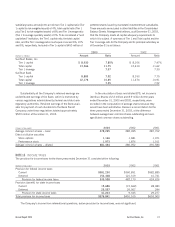
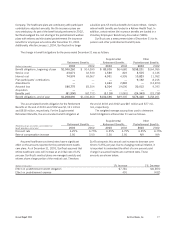
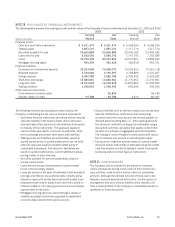
The change in plan assets for the years ended December 31 was as follows:
Other
Retirement Benefits Postretirement Benefits
(Dollars in thousands) 2003 2002 2003 2002
Fair value of plan assets, beginning of year $1,025,873 $1,096,878 $140,669 $122,794
Actual return on plan assets 307,349 (124,174) 17,740 (6,983)
Foreign currency exchange rate changes ————
Acquisition ————
Employer contribution 300,000 115,900 4,971 40,380
Plan participants’ contributions ——9,192 8,216
Benefits paid (81,990) (62,731) (24,343) (23,738)
Fair value of plan assets, end of year $1,551,232 $1,025,873 $148,229 $140,669
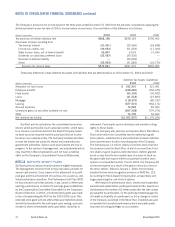
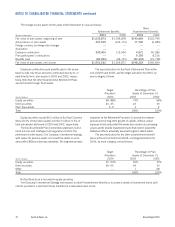
Target Percentage of Plan
Allocation Assets at December 31
(Asset Category) 2004 2003 2002
Equity securities 58–88% 74% 68%
Debt securities 20–25 23 30
Cash Equivalents 0–5 3 2
Total 100% 100%
Employer contributions and benefits paid in the above
table include only those amounts contributed directly to, or
paid directly from, plan assets in 2003 and 2002, respec-
tively. Note that the other Supplemental Retirement Plans
are not funded through Trust assets.
The asset allocation for SunTrust’s Retirement Plan at the
end of 2003 and 2002, and the target allocation for 2004, by
asset category, follows.
Target Percentage of Plan
Allocation Assets at December 31
(Asset Category) 2004 2003 2002
Equity securities 35–50% 50% 33%
Debt securities 50–65 49 39
Other —128
Total 100% 100%
No SunTrust stock is included in equity securities.
The Company’s Investment Strategy with respect to other Postretirement Benefits is to create a stream of investment return suffi-
cient to provide for current and future liabilities at a reasonable level of risk.
Equity securities include $4.2 million of SunTrust Common
Stock (0.3% of total plan assets) and $3.3 million (0.3% of
total plan assets) at the end of 2003 and 2002, respectively.
The SunTrust Benefit Plan Committee establishes invest-
ment policies and strategies and regularly monitors the
performance of the assets. The Company’s investment strategy
with respect to pension assets is to invest the assets in accor-
dance with ERISA and fiduciary standards. The long-term primary
objectives for the Retirement Plan are to 1) provide for a reason-
able amount of long-term growth of capital, without undue
exposure to risk; and protect the assets from erosion of purchasing
power, and 2) provide investment results that meet or exceed the
Retirement Plan’s actuarially assumed long-term rate of return.
The asset allocation for the other postretirement benefit
plans at the end of 2003 and 2002, and target allocation for
2004, by asset category, are as follows: