SunTrust 2003 Annual Report Download - page 16
Download and view the complete annual report
Please find page 16 of the 2003 SunTrust annual report below. You can navigate through the pages in the report by either clicking on the pages listed below, or by using the keyword search tool below to find specific information within the annual report.-
 1
1 -
2
-
3
-
4
-
5
-
 6
6 -
 7
7 -
 8
8 -
 9
9 -
 10
10 -
 11
11 -
 12
12 -
 13
13 -
 14
14 -
 15
15 -
 16
16 -
 17
17 -
 18
18 -
 19
19 -
 20
20 -
 21
21 -
 22
22 -
 23
23 -
 24
24 -
 25
25 -
 26
26 -
27
-
28
-
29
-
30
-
31
-
32
-
33
-
34
-
35
-
36
-
37
-
38
-
39
-
40
-
41
-
42
-
43
-
44
-
45
-
46
-
47
-
48
-
49
-
50
-
51
-
52
-
53
-
54
-
55
-
56
-
57
-
58
-
59
-
60
-
61
-
62
-
63
-
64
-
65
-
66
-
67
-
68
-
69
-
70
-
71
-
72
-
73
-
74
-
75
-
76
-
77
-
78
-
79
-
80
-
81
-
82
-
83
-
84
-
85
-
86
-
87
-
88
-
89
-
90
-
91
-
92
-
93
-
94
-
95
-
96
-
97
-
98
-
99
-
100
-
101
-
102
-
103
-
104
 |
 |

14 SunTrust Banks, Inc. Annual Report 2003
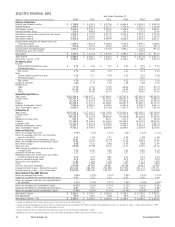
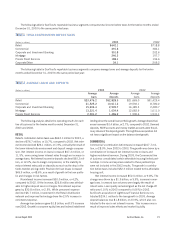
SELECTED FINANCIAL DATA Year Ended December 31
(Dollars in millions except per share and other data) 2003 2002 2001 2000 1999 1998
Summary of Operations
Interest and dividend income $4,768.8 $5,135.2 $ 6,279.6 $ 6,845.4 $ 5,960.2 $ 5,675.9
Interest expense 1,448.5 1,891.5 3,027.0 3,736.9 2,814.7 2,746.8
Net interest income 3,320.3 3,243.7 3,252.6 3,108.5 3,145.5 2,929.1
Provision for loan losses 313.6 469.8 275.2 134.0 170.4 214.6
Net interest income after provision for loan losses 3,006.7 2,773.9 2,977.4 2,974.5 2,975.1 2,714.5
Noninterest income12,303.0 2,268.8 2,051.9 1,773.6 1,625.9 1,653.9
Noninterest expense2, 3 3,400.6 3,219.4 2,999.9 2,828.5 2,905.3 2,870.1
Income before provision for income taxes and
extraordinary gain 1,909.1 1,823.3 2,029.4 1,919.6 1,695.7 1,498.3
Provision for income taxes 576.8 491.5 653.9 625.5 571.7 527.3
Income before extraordinary gain 1,332.3 1,331.8 1,375.5 1,294.1 1,124.0 971.0
Extraordinary gain, net of taxes4————202.6 —
Net income $1,332.3 $1,331.8 $ 1,375.5 $ 1,294.1 $ 1,326.6 $ 971.0
Total revenue $5,668.3 $5,552.1 $ 5,345.2 $ 4,922.1 $ 4,813.9 $ 4,627.4
Net interest income – FTE 3,365.3 3,283.2 3,293.4 3,148.4 3,188.0 2,973.5
Per Common Share
Diluted
Income before extraordinary gain $4.73 $4.66 $ 4.72 $ 4.30 $ 3.50 $ 3.04
Extraordinary gain ————0.63 —
Net income 4.73 4.66 4.72 4.30 4.13 3.04
Basic
Income before extraordinary gain 4.79 4.71 4.78 4.35 3.54 3.08
Extraordinary gain ————0.64 —
Net income 4.79 4.71 4.78 4.35 4.18 3.08
Dividends declared 1.80 1.72 1.60 1.48 1.38 1.00
Market price:
High 71.73 70.20 72.35 68.06 79.81 87.75
Low 51.44 51.48 57.29 41.63 60.44 54.00
Close 71.50 56.92 62.70 63.00 68.81 76.50
Selected Average Balances
Total assets $122,325.4 $108,516.1 $102,884.2 $ 98,397.8 $92,820.8 $85,536.9
Earning assets 109,257.4 96,370.8 92,034.1 88,609.0 82,255.7 74,880.9
Loans 76,137.9 71,270.4 70,023.0 70,044.3 62,749.4 57,590.5
Deposits 80,039.0 71,157.2 64,568.7 66,691.9 57,842.1 53,725.3
Realized shareholders’ equity 7,596.9 6,984.6 6,328.0 6,031.6 6,368.3 5,641.4
Total shareholders’ equity 9,083.0 8,725.7 8,073.8 7,501.9 8,190.7 7,853.6
At December 31
Total assets $125,393.2 $117,322.5 $104,740.6 $103,660.4 $95,390.0 $93,169.9
Earning assets 112,519.6 104,759.6 93,327.5 92,147.8 85,193.4 81,295.1
Loans 80,732.3 73,167.9 68,959.2 72,239.8 66,002.8 61,540.6
Allowance for loan losses 941.9 930.1 867.1 874.5 871.3 944.6
Deposits 81,189.5 79,706.6 67,536.4 69,533.3 60,100.5 59,033.3
Long-term debt 15,313.9 11,879.8 12,660.6 8,945.4 6,017.3 5,807.9
Realized shareholders’ equity 8,067.1 7,260.0 6,704.3 6,296.4 6,064.0 6,090.4
Total shareholders’ equity 9,731.2 8,769.5 8,359.6 8,239.2 7,626.9 8,178.6
Ratios and Other Data
Return on average total assets 1.09% 1.23% 1.34% 1.32% 1.43% 1.14%
Return on average assets less net unrealized
gains on securities 1.11 1.26 1.37 1.35 1.48 1.18
Return on average total shareholders’ equity 14.67 15.26 17.04 17.25 16.20 12.36
Return on average realized shareholders’ equity 17.54 19.07 21.74 21.46 20.83 17.21
Net interest margin 3.08 3.41 3.58 3.55 3.88 3.97
Efficiency ratio 59.99 57.99 56.12 57.47 60.35 62.02
Total average shareholders’ equity to total
average assets 7.43 8.04 7.85 7.62 8.82 9.18
Allowance to year-end loans 1.17 1.27 1.26 1.21 1.32 1.53
Nonperforming assets to total loans plus OREO
and other repossessed assets 0.47 0.74 0.87 0.61 0.43 0.40
Common dividend payout ratio 37.9 36.8 33.7 34.3 33.4 32.9
Full-service banking offices 1,183 1,184 1,128 1,129 1,114 1,079
ATMs 2,225 2,286 1,944 1,991 1,968 1,839
Full-time equivalent employees 27,578 27,622 28,391 28,268 30,222 30,452
Average common shares – diluted (thousands) 281,434 286,052 291,584 300,956 321,174 319,711
Average common shares – basic (thousands) 278,295 282,495 287,702 297,834 317,079 314,908
Reconcilement of Non-GAAP Measures
Return on average total assets 1.09% 1.23% 1.34% 1.32% 1.43% 1.14%
Impact of excluding net unrealized securities gains 0.02 0.03 0.03 0.03 0.05 0.04
Return on average assets less net unrealized gains
on securities 1.11% 1.26% 1.37% 1.35% 1.48% 1.18%
Return on average total shareholders’ equity 14.67% 15.26% 17.04% 17.25% 16.20% 12.36%
Impact of excluding net unrealized securities gains 2.87 3.81 4.70 4.21 4.63 4.85
Return on average realized shareholders’ equity 17.54% 19.07% 21.74% 21.46% 20.83% 17.21%
Net interest income $3,320.3 $3,243.7 $ 3,252.6 $ 3,108.5 $ 3,145.5 $ 2,929.1
FTE Adjustment 45.0 39.5 40.8 39.9 42.5 44.4
Net interest income – FTE $3,365.3 $3,283.2 $ 3,293.4 $ 3,148.4 $ 3,188.0 $ 2,973.5
1Includes an additional $52.9 million security gain in 2001 on the sale of STAR Systems, Inc.
2Includes merger-related expenses of $16.0 million in 2002 related to the acquisition of the Florida franchise of Huntington Bancshares, Inc. and $42.4 million in 2000, $45.6 million in 1999
and $119.4 million in 1998 related to the acquisition of Crestar.
3Includes expenses of $32.0 million from the proposal to acquire the former Wachovia Corporation in 2001.
4Represents the gain on sale of the Company’s consumer credit card portfolio in 1999, net of $124.6 million in taxes.